Diamond Life DFS Casino Solves NFL Week 5 – Deeper Dive! (DK AND FD Week 5 Main Slates)
Diamond Life BREAKS DOWN NFL WEEK 5 (DK MAIN SLATE)
General discussion of game environments
The Diamond Life NFL Solver identifies a slate where the strongest raw-ceiling environment is also attracting substantial ownership, creating an opportunity to differentiate through alternative game stacks and premium player pivots.
Detroit–Arizona stands above the field with a combined offensive SACP of 435.70 and a 54.5-point Vegas total. However, Gibbs at 65.7% ownership and Amon-Ra St. Brown at 32.1% make roster construction especially important.
Cincinnati–Miami provides a different opportunity. Joe Burrow is projected at just 4.3% ownership despite Cincinnati having the second-highest team offensive SACP on the slate. Pairing Burrow with Ja’Marr Chase creates a credible alternative to the Detroit-heavy builds.
Top game
435.7
DET–ARI SACP
Highest ceiling
68.4
Gibbs P99
Leverage QB
4.3%
Burrow RST%
The key isn’t simply chasing the highest Vegas total. We want games where scoring expectations, solver ceiling and ownership combine to create a viable path to first place.
Our primary game-environment priorities are Detroit–Arizona, Cincinnati–Miami and Seattle–San Francisco. Green Bay–Chicago and New England–Las Vegas provide additional ways to diversify.
Methodology: SACP, XVO v3.1, P99 and ownership-adjusted separation come from the previously analyzed solver output. Combined team SACP is an aggregate of individual modeled ceilings, not a jointly simulated game score or a probability of a shootout. The figures are model estimates rather than validated tournament ROI.
1. Top solver plays by position
Rankings are driven by SACP, with ownership and extreme-tail outcomes used to distinguish tournament utility.
Quarterbacks
| Rank | Player | Salary | SACP | RST% |
|---|---|---|---|---|
| 1 | Jared Goff | $6,600 | 41.70 | 12.8% |
| 2 | Drake Maye | $6,300 | 36.33 | 8.4% |
| 3 | Joe Burrow | $6,900 | 35.77 | 4.3% |
| 4 | Jacoby Brissett | $5,500 | 34.55 | 6.0% |
| 5 | Bo Nix | $5,600 | 32.44 | 7.1% |
| 6 | Brock Purdy | $6,500 | 32.21 | 2.3% |
| 7 | Jordan Love | $5,700 | 32.04 | 5.1% |
| 8 | Jayden Daniels | $6,000 | 31.61 | 4.7% |
| 9 | Sam Darnold | $5,800 | 31.34 | 4.7% |
| 10 | Kyler Murray | $5,200 | 31.19 | 8.9% |
QB read: Goff leads in raw ceiling. Burrow is the strongest combination of high offensive environment and lower ownership. Brissett provides salary flexibility, while Purdy is the more aggressive low-owned option.
Running backs
| Rank | Player | Salary | SACP | RST% |
|---|---|---|---|---|
| 1 | Jahmyr Gibbs | $9,800 | 55.35 | 65.7% |
| 2 | Jonathan Taylor | $7,800 | 40.16 | 6.8% |
| 3 | Christian McCaffrey | $8,200 | 39.05 | 4.7% |
| 4 | Chase Brown | $6,900 | 36.81 | 31.0% |
| 5 | Ashton Jeanty | $7,200 | 34.02 | 4.5% |
| 6 | Jaylen Warren | $6,700 | 32.38 | 6.9% |
| 7 | Braelon Allen | $5,400 | 32.06 | 21.6% |
| 8 | D’Andre Swift | $6,200 | 30.67 | 6.0% |
| 9 | Aaron Jones | $6,500 | 29.40 | 4.8% |
| 10 | Rhamondre Stevenson | $5,500 | 27.98 | 11.5% |
RB read: Gibbs is the clear ceiling leader, but Taylor and McCaffrey offer enormous ownership discounts. Jeanty is an interesting secondary separator.
Wide receivers
| Rank | Player | Salary | SACP | RST% |
|---|---|---|---|---|
| 1 | Jaxon Smith-Njigba | $8,800 | 53.62 | 38.9% |
| 2 | Amon-Ra St. Brown | $7,900 | 48.64 | 32.1% |
| 3 | Ja’Marr Chase | $8,100 | 46.01 | 14.9% |
| 4 | Nico Collins | $7,500 | 39.11 | 8.1% |
| 5 | Michael Wilson | $6,200 | 38.01 | 12.4% |
| 6 | Chris Olave | $7,700 | 37.58 | 5.1% |
| 7 | Justin Jefferson | $7,300 | 37.50 | 10.5% |
| 8 | Garrett Wilson | $6,600 | 36.33 | 12.8% |
| 9 | Christian Watson | $6,400 | 35.50 | 12.9% |
| 10 | Malik Nabers | $6,300 | 32.31 | 4.9% |
WR read: Smith-Njigba leads in raw ceiling, but Chase is a particularly appealing tournament spend-up. Collins and Olave offer additional premium leverage.
Tight ends
| Rank | Player | Salary | SACP | RST% |
|---|---|---|---|---|
| 1 | Trey McBride | $6,700 | 44.80 | 15.9% |
| 2 | Brock Bowers | $7,000 | 37.69 | 6.4% |
| 3 | Sam LaPorta | $4,900 | 32.18 | 13.9% |
| 4 | George Kittle | $5,200 | 30.18 | 5.7% |
| 5 | Isaiah Likely | $4,300 | 26.88 | 6.8% |
| 6 | Tyler Warren | $5,000 | 26.70 | 2.7% |
| 7 | Tucker Kraft | $4,700 | 26.14 | 5.0% |
| 8 | Harold Fannin | $4,400 | 25.58 | 4.0% |
| 9 | Juwan Johnson | $4,500 | 24.00 | 3.1% |
| 10 | T.J. Hockenson | $4,800 | 23.35 | 2.9% |
TE read: McBride has the strongest raw-ceiling profile. Bowers offers premium leverage; LaPorta and Kittle are attractive midrange options.
Defenses
| Rank | Defense | Salary | SACP | RST% |
|---|---|---|---|---|
| 1 | Houston Texans | $3,400 | 21.63 | 8.8% |
| 2 | Cincinnati Bengals | $3,500 | 19.83 | 4.5% |
| 3 | Denver Broncos | $3,200 | 18.72 | 4.2% |
| 4 | New York Jets | $2,700 | 18.30 | 7.2% |
| 5 | Minnesota Vikings | $3,100 | 18.03 | 3.5% |
| 6 | Washington Commanders | $2,900 | 17.91 | 4.2% |
| 7 | Chicago Bears | $2,900 | 15.43 | 4.4% |
| 8 | Pittsburgh Steelers | $3,300 | 15.41 | 2.6% |
| 9 | New England Patriots | $3,000 | 15.20 | 3.8% |
| 10 | Cleveland Browns | $2,800 | 15.19 | 5.0% |
DST read: Houston is the top raw-ceiling defense. Minnesota offers a compelling low-owned alternative.
2. Best spend-ups
| Player | Salary | SACP | P99 | RST% | Tournament role |
|---|---|---|---|---|---|
| Gibbs | $9,800 | 55.35 | 68.42 | 65.7% | Highest raw ceiling |
| Smith-Njigba | $8,800 | 53.62 | 66.84 | 38.9% | Elite WR ceiling |
| St. Brown | $7,900 | 48.64 | 62.44 | 32.1% | Detroit correlation |
| Chase | $8,100 | 46.01 | 59.49 | 14.9% | Premium WR leverage |
| McBride | $6,700 | 44.80 | 58.21 | 15.9% | Elite TE ceiling |
| Taylor | $7,800 | 40.16 | 50.50 | 6.8% | RB ownership pivot |
| McCaffrey | $8,200 | 39.05 | 49.32 | 4.7% | RB separator |
| Collins | $7,500 | 39.11 | 50.81 | 8.1% | WR separator |
Preferred tournament spend-ups: Chase, Taylor and McBride.
Gibbs and Smith-Njigba remain excellent raw-ceiling plays, but they require more differentiation elsewhere. The objective is not to fade every popular player; it is to avoid building an entire lineup around the same ceiling outcomes as the field.
3. Best values
| Player | Pos | Salary | SACP | RST% | Value thesis |
|---|---|---|---|---|---|
| Brissett | QB | $5,500 | 34.55 | 6.0% | Affordable stacking QB |
| Malik Willis | QB | $4,600 | 28.8 | 3.9% | Cheap QB ceiling |
| Braelon Allen | RB | $5,400 | 32.06 | 21.6% | Strong modeled ceiling per dollar |
| Ollie Gordon | RB | $5,300 | 26.1 | 4.0% | Low-owned RB alternative |
| Michael Wilson | WR | $6,200 | 38.01 | 12.4% | High-upside midrange WR |
| Roman Wilson | WR | $3,700 | 21.5 | 17.2% | Salary-saving receiver |
| Malik Washington | WR | $4,600 | 25.1 | 5.4% | Lower-owned salary relief |
| LaPorta | TE | $4,900 | 32.18 | 13.9% | Detroit stack value |
| AJ Barner | TE | $3,200 | 20.8 | 13.9% | Cheap TE ceiling |
| Hunter Henry | TE | $3,700 | 22.7 | 9.7% | Maye stack partner |
Brissett, Michael Wilson and LaPorta are my preferred midrange values. Roman Wilson and Barner can help fund premium ceiling, but they should be evaluated against the opportunity cost of the roster spots they occupy.
4. Best sleepers/right-tail separators
Low ownership is most valuable when paired with a realistic upper-tail outcome.
| Player | Pos | RST% | P99 | Tail Leverage |
|---|---|---|---|---|
| Brock Purdy | QB | 2.3% | 37.07 | 212.4 |
| Joe Burrow | QB | 4.3% | 42.07 | 172.5 |
| Christian McCaffrey | RB | 4.7% | 49.32 | 180.1 |
| Ashton Jeanty | RB | 4.5% | 41.82 | 160.4 |
| Chris Olave | WR | 5.1% | 49.27 | 166.4 |
| Nico Collins | WR | 8.1% | 50.81 | 137.4 |
| Brock Bowers | TE | 6.4% | 48.99 | 149.0 |
| Tyler Warren | TE | 2.7% | 34.45 | 162.5 |
Three strongest separator profiles
Joe Burrow: 35.77 SACP at 4.3% ownership, with a strong correlation partner in Chase.
Christian McCaffrey: Nearly 50-point P99 at 4.7% ownership, making him a powerful Gibbs alternative.
Chris Olave: Premium WR with 49.27 P99 and only 5.1% ownership.
5. Top five game environments
These rankings use the combined offensive SACP from both teams, alongside Vegas scoring expectations and tournament ownership.
| Rank | Game | Combined SACP | Vegas O/U | Primary edge |
|---|---|---|---|---|
| 1 | DET–ARI | 435.70 | 54.5 | Best overall shootout |
| 2 | GB–CHI | 373.46 | 45.5 | Balanced ceiling |
| 3 | CIN–MIA | 370.07 | 42.5 | Cincinnati leverage |
| 4 | SEA–SF | 367.40 | 46.5 | Two-sided star upside |
| 5 | NE–LV | 361.71 | 45.0 | Secondary leverage |
Combined offensive ceiling by game
Team-level SACP sums, not projected fantasy points for an actual game.

■ Offense A
■ Offense B
Game-environment interpretation
Detroit–Arizona: The strongest combination of Vegas total and two-sided modeled ceiling. Both offenses have multiple players capable of producing substantial upper-tail outcomes.
Green Bay–Chicago: A balanced game with nearly equal offensive SACP totals. It offers alternative constructions without requiring the highest-priced QB and receiver combinations.
Cincinnati–Miami: Cincinnati contributes almost 60% of the game’s combined SACP. The appeal is Burrow and Chase exceeding expectations rather than necessarily requiring both offenses to produce elite fantasy totals.
Seattle–San Francisco: Smith-Njigba offers enormous WR upside, while Purdy and McCaffrey provide low-owned exposure to the opposing offense.
New England–Las Vegas: Maye, Bowers and Jeanty create several ways to attack the matchup. This game is more interesting as a selective stack than an automatic full-game onslaught.
6. Best full onslaught/game-stack environments
Full onslaughts seek multiple players reaching their ceilings within the same game. They become most attractive when both offenses have meaningful scoring upside and the lineup can capture concentrated touchdowns.
| Priority | Game | Recommended structure | Tournament profile |
|---|---|---|---|
| 1 | DET–ARI | Goff + St. Brown + LaPorta, McBride bring-back | Highest raw ceiling |
| 2 | DET–ARI | Brissett + McBride + Michael Wilson, St. Brown bring-back | Salary-efficient alternative |
| 3 | SEA–SF | Darnold + Smith-Njigba, McCaffrey bring-back | Premium two-sided upside |
| 4 | CIN–MIA | Burrow + Chase, selective Miami bring-back | Lower-owned ceiling |
| 5 | NE–LV | Maye + Henry, Bowers bring-back | Secondary game-stack leverage |
The three most compelling constructions
DET–ARI: Goff-led onslaught
Goff + St. Brown + LaPorta, with McBride coming back.
This captures the strongest modeled scoring environment and concentrates exposure around the Detroit passing game. The tradeoff is that St. Brown and McBride are both popular.
CIN–MIA: Burrow-led leverage stack
Burrow + Chase, with an opposing receiver added only if his individual ceiling and ownership justify the roster spot.
The strongest attraction is Burrow’s 4.3% ownership combined with Cincinnati’s high offensive SACP.
SEA–SF: Contrarian San Francisco game script
Purdy + a qualifying San Francisco pass catcher, with Smith-Njigba as the bring-back.
This construction becomes especially interesting if San Francisco controls the scoring while Seattle must remain aggressive through the air.
A full onslaught should not be forced just because the game’s aggregate SACP is high. The individual pass catchers must still offer sufficient ceiling, and the salary allocation must leave room for strong one-offs.
7. Recommended bring-back structures
| Primary stack | Bring-back | Reason |
|---|---|---|
| Goff + St. Brown | Trey McBride | Arizona’s highest individual SACP |
| Goff + LaPorta | Michael Wilson | Alternative Arizona ceiling at lower salary |
| Brissett + McBride | Amon-Ra St. Brown | Strong Detroit receiving ceiling |
| Darnold + Smith-Njigba | Christian McCaffrey | Lower-owned opposing premium RB |
| Burrow + Chase | Qualifying Miami receiver | Potential passing-game correlation |
| Love + Watson | D’Andre Swift | Chicago RB ceiling with lower ownership |
| Maye + Henry | Brock Bowers | Premium opposing TE ceiling |
| Purdy + SF receiver | Smith-Njigba | Elite Seattle upper-tail outcome |
Bring-back principle: A single high-quality opponent is generally preferable to forcing two weak plays simply to increase game correlation.
For Detroit–Arizona, a double bring-back is defensible because both McBride and Michael Wilson have strong modeled ceilings. For Cincinnati–Miami, I would be more selective because the game’s aggregate ceiling is heavily concentrated on Cincinnati.
8. SE vs. 3-Max priorities
Single-Entry
Balanced ceiling and leverage
Preferred QB: Goff or Burrow
Primary game: Detroit–Arizona
Priority spend-ups: Chase, Taylor, McBride
Strategy: Build around one strong correlated stack, use one or two deliberate leverage plays, and avoid accumulating unnecessary low-probability outcomes.
3-Max
Diversified ceiling paths
| Build | QB focus | Game focus | RB approach |
|---|---|---|---|
| A | Goff | DET–ARI | Gibbs considered |
| B | Burrow | CIN–MIA | Taylor |
| C | Brissett | ARI–DET | McCaffrey or Jeanty |
The objective is to create three genuinely different first-place scenarios rather than three variations of the same popular roster.
Large-field GPP
Maximum separation
Preferred leverage QBs: Burrow, Purdy, Brissett
Premium separators: McCaffrey, Taylor, Olave, Collins, Bowers
Strategy: Emphasize P95/P99 access and ownership differentiation. Explore less popular game scripts without sacrificing too much ceiling merely to be contrarian.
9. Key fragile-chalk/fade considerations
Fragile chalk does not necessarily mean a player is likely to fail. It means the ownership and salary create tournament risk if the player produces an ordinary outcome or if a lower-owned alternative produces a similar ceiling.
| Chalk player | RST% | Concern | Potential pivot |
|---|---|---|---|
| Jahmyr Gibbs | 65.7% | Extreme ownership and $9,800 salary | Taylor / McCaffrey |
| Smith-Njigba | 38.9% | Premium price and concentrated ownership | Chase / Collins |
| St. Brown | 32.1% | Popular Detroit exposure | Olave / Michael Wilson |
| Chase Brown | 31.0% | RB ownership concentration | Jeanty / Warren |
| Braelon Allen | 21.6% | Midrange value ownership | Swift / Aaron Jones |
The Gibbs decision
Jahmyr Gibbs
55.35
SACP · 65.7% owned
Highest RB ceiling and the clearest raw-point path.
Jonathan Taylor
40.16
SACP · 6.8% owned
Lower ceiling, but $2,000 cheaper and far less popular.
Gibbs has the stronger modeled individual outcome. Taylor offers a different tournament proposition: substantial salary savings, a high-end P99 of 50.50, and a dramatically smaller ownership burden.
For Single-Entry, playing Gibbs can still be entirely reasonable. In a large-field tournament, pivoting to Taylor or McCaffrey creates an alternative first-place path if Gibbs fails to separate.
10. Final condensed player pool and slate strategy
Recommended tournament player pool
| Position | Core ceiling | Leverage targets | Salary relief |
|---|---|---|---|
| QB | Goff, Maye | Burrow, Purdy | Brissett, Love |
| RB | Gibbs, Taylor | McCaffrey, Jeanty | Allen, Swift |
| WR | Smith-Njigba, St. Brown | Chase, Collins, Olave | Michael Wilson, Roman Wilson |
| TE | McBride | Bowers, Kittle | LaPorta, Barner |
| DST | Houston | Minnesota, Cincinnati | Jets, Washington |
Final strategic rankings
| Category | First choice | Alternative |
|---|---|---|
| Best raw-ceiling QB | Jared Goff | Drake Maye |
| Best leverage QB | Joe Burrow | Brock Purdy |
| Best premium RB | Jahmyr Gibbs | Jonathan Taylor |
| Best RB separator | Christian McCaffrey | Ashton Jeanty |
| Best premium WR | Jaxon Smith-Njigba | Ja’Marr Chase |
| Best WR separator | Chris Olave | Nico Collins |
| Best TE | Trey McBride | Brock Bowers |
| Best value TE | Sam LaPorta | AJ Barner |
| Best DST | Houston Texans | Minnesota Vikings |
| Best game environment | DET–ARI | SEA–SF |
| Best leverage offense | Cincinnati | Arizona |
Overall slate strategy
The strongest approach is to use Detroit–Arizona as the raw-ceiling benchmark, while actively considering Cincinnati-led stacks as a way to exploit ownership concentration.
For Single-Entry, I favor a balanced approach built around Goff or Burrow, a premium receiving target, and one carefully selected ownership pivot.
For 3-Max, my preferred portfolio is one Detroit-led construction, one Cincinnati-led construction and one Arizona-led construction. This provides three different game-script outcomes.
For very large-field tournaments, Burrow–Chase, Taylor, McCaffrey, Collins and Olave are the players I would investigate most closely for high-ceiling separation. These are not automatic plays; their value depends on the completed roster and contest field.
The central takeaway: Gibbs and Smith-Njigba can be the highest-scoring players on the slate without necessarily being the best tournament decisions at their projected ownership. The greatest opportunity may come from retaining comparable right-tail upside while building a roster the field is much less likely to duplicate.
Final verification: These conclusions use the supplied slate projections and previously generated individual-outcome solver estimates. They are not live injury confirmations or completed joint game-state simulations. Confirm player eligibility, roles and injuries before finalizing entries.
Download Diamond Life NFL Solver Workbook
Fanduel NFL Week 5 Analysis
General Discussion: Game Environments and Slate Strategy
The central theme of this slate is the separation between elite raw-ceiling environments and under-owned tournament opportunities.
Arizona–Detroit leads the slate in both Vegas total and aggregate offensive SACP. However, several of its key players carry significant ownership. Cincinnati–Miami and Seattle–San Francisco offer alternative paths to tournament-winning outcomes through lower-owned quarterbacks and premium receiving options.
Our objective is not simply to roster the highest SACP players. It is to identify where a player’s ceiling, ownership and game correlation create a lineup that can outperform the field.
Slate environment overview
| Matchup | Vegas O/U | Aggregate SACP | Strategic identity |
|---|---|---|---|
| ARI–DET | 54.5 | 399.2 | Highest raw ceiling |
| CHI–GB | 45.5 | 353.4 | Low-owned QB stack |
| CIN–MIA | 42.5 | 343.4 | Premium QB leverage |
| SEA–SF | 46.5 | 343.0 | High-upside contrarian stack |
| LV–NE | 45.0 | 337.2 | Secondary stack opportunity |
Figures are from the previously reported October 9 solver results. Aggregate SACP sums individual player ceilings, not simultaneous game outcomes. Recommendations assume the slate’s player availability and matchups remain valid.
The three main strategic observations
- Detroit is the strongest raw-ceiling offense, but its ownership concentration makes full Detroit stacks potentially duplicated.
- Burrow and Purdy are major QB leverage candidates, with substantial modeled ceiling at a fraction of Goff’s projected ownership.
- Premium RB and WR pivots are particularly important. McCaffrey, Chase and Jefferson offer ways to move away from popular ceiling anchors without abandoning upside.
The following breakdown prioritizes SACP 2.0, ownership-adjusted right-tail access, salary efficiency and tournament correlation.
1. Top solver plays by position
Ranked by SACP 2.0, our primary ceiling metric.
Quarterbacks
| Rank | Player | Salary | SACP | RST% |
|---|---|---|---|---|
| 1 | Jared Goff | $8,100 | 39.4 | 36.2% |
| 2 | Joe Burrow | $8,700 | 35.6 | 3.6% |
| 3 | Drake Maye | $7,800 | 34.8 | 10.7% |
| 4 | Jacoby Brissett | $6,800 | 32.7 | 32.7% |
| 5 | Bo Nix | $7,600 | 31.6 | 2.3% |
| 6 | Brock Purdy | $8,300 | 31.5 | 1.1% |
| 7 | Jordan Love | $7,400 | 31.5 | 2.7% |
| 8 | Jayden Daniels | $8,000 | 31.4 | 1.2% |
| 9 | Kyler Murray | $7,000 | 30.9 | 3.1% |
| 10 | Aaron Rodgers | $7,000 | 30.3 | 2.1% |
QB interpretation: Goff is the raw-ceiling leader. Burrow offers the strongest premium ownership discount, while Purdy and Love provide more aggressive differentiation.
Running backs
| Rank | Player | Salary | SACP | RST% |
|---|---|---|---|---|
| 1 | Jahmyr Gibbs | $10,000 | 52.2 | 42.2% |
| 2 | Jonathan Taylor | $8,600 | 39.6 | 17.3% |
| 3 | Christian McCaffrey | $8,400 | 36.3 | 9.7% |
| 4 | Chase Brown | $8,000 | 34.7 | 12.6% |
| 5 | Braelon Allen | $5,900 | 32.3 | 18.2% |
| 6 | Ashton Jeanty | $7,800 | 31.4 | 7.7% |
| 7 | Jaylen Warren | $6,700 | 30.9 | 13.7% |
| 8 | D’Andre Swift | $6,500 | 30.3 | 11.9% |
| 9 | Aaron Jones | $6,200 | 29.1 | 14.2% |
| 10 | David Montgomery | $6,800 | 27.7 | 6.2% |
RB interpretation: Gibbs has a commanding ceiling advantage. McCaffrey, Taylor and Chase Brown offer alternative premium constructions. Allen is a particularly useful salary-relief candidate.
Wide receivers
| Rank | Player | Salary | SACP | RST% |
|---|---|---|---|---|
| 1 | Jaxon Smith-Njigba | $9,300 | 49.5 | 32.0% |
| 2 | Amon-Ra St. Brown | $9,000 | 44.6 | 26.4% |
| 3 | Ja’Marr Chase | $8,900 | 40.5 | 12.0% |
| 4 | Nico Collins | $7,800 | 36.3 | 13.3% |
| 5 | Chris Olave | $8,300 | 34.9 | 11.1% |
| 6 | Justin Jefferson | $8,000 | 34.9 | 8.8% |
| 7 | Michael Wilson | $6,400 | 34.3 | 25.5% |
| 8 | Christian Watson | $7,000 | 34.0 | 14.7% |
| 9 | Garrett Wilson | $7,400 | 33.2 | 11.8% |
| 10 | Malik Nabers | $7,300 | 29.1 | 9.0% |
WR interpretation: Smith-Njigba and St. Brown lead the position in raw ceiling. Chase and Jefferson are attractive lower-owned premium alternatives.
Tight ends
| Rank | Player | Salary | SACP | RST% |
|---|---|---|---|---|
| 1 | Trey McBride | $7,200 | 38.0 | 12.7% |
| 2 | Brock Bowers | $7,800 | 32.9 | 7.4% |
| 3 | Sam LaPorta | $6,000 | 28.5 | 8.2% |
| 4 | George Kittle | $6,700 | 27.7 | 5.9% |
| 5 | Isaiah Likely | $5,300 | 24.9 | 7.4% |
| 6 | Tucker Kraft | $5,600 | 23.8 | 5.8% |
| 7 | Harold Fannin | $5,400 | 22.9 | 5.5% |
| 8 | Juwan Johnson | $5,400 | 22.7 | 4.8% |
| 9 | Tyler Warren | $5,500 | 22.2 | 6.3% |
| 10 | Hunter Henry | $5,100 | 20.7 | 4.0% |
TE interpretation: McBride provides the strongest raw ceiling, Bowers offers premium leverage, and LaPorta is an attractive midrange option.
Defenses
| Rank | Defense | Salary | SACP | RST% |
|---|---|---|---|---|
| 1 | Houston Texans | $5,000 | 24.7 | 7.6% |
| 2 | Cincinnati Bengals | $4,900 | 22.3 | 4.3% |
| 3 | Denver Broncos | $4,700 | 21.1 | 5.9% |
| 4 | New York Jets | $4,000 | 20.6 | 17.7% |
| 5 | Minnesota Vikings | $4,600 | 20.4 | 3.8% |
| 6 | Washington Commanders | $3,300 | 20.2 | 21.9% |
| 7 | New England Patriots | $4,500 | 18.0 | 1.0% |
| 8 | Chicago Bears | $4,400 | 17.6 | 0.9% |
| 9 | Pittsburgh Steelers | $4,800 | 17.3 | 0.9% |
| 10 | Cleveland Browns | $3,900 | 17.2 | 5.5% |
DST interpretation: Houston leads the position in SACP. Minnesota offers a compelling combination of ceiling and ownership separation.
2. Best spend-ups
These players offer the strongest premium-ceiling opportunities, with ownership determining their tournament roles.
| Player | Position | Salary | SACP | Ownership | Tournament role |
|---|---|---|---|---|---|
| Jahmyr Gibbs | RB | $10,000 | 52.2 | 42.2% | Elite ceiling anchor |
| Jaxon Smith-Njigba | WR | $9,300 | 49.5 | 32.0% | Premium WR anchor |
| Amon-Ra St. Brown | WR | $9,000 | 44.6 | 26.4% | Correlated DET ceiling |
| Ja’Marr Chase | WR | $8,900 | 40.5 | 12.0% | Premium leverage |
| Jonathan Taylor | RB | $8,600 | 39.6 | 17.3% | Alternative RB ceiling |
| Christian McCaffrey | RB | $8,400 | 36.3 | 9.7% | Contrarian RB spend-up |
| Joe Burrow | QB | $8,700 | 35.6 | 3.6% | QB leverage |
Spend-up priority
Best raw ceiling: Jahmyr Gibbs
52.2 SACP
Best WR ceiling: Jaxon Smith-Njigba
49.5 SACP
Best premium WR pivot: Ja’Marr Chase
40.5 SACP
Best RB ownership pivot: Christian McCaffrey
36.3 SACP
Gibbs is difficult to match in raw ceiling. However, his ownership makes it important to differentiate elsewhere. Chase and McCaffrey are particularly useful when constructing lineups that move away from popular Detroit and Seattle combinations.
3. Best values
These players offer strong salary-adjusted ceiling access without requiring premium investment.
| Player | Position | Salary | SACP | SACP/$1K | RST% |
|---|---|---|---|---|---|
| Braelon Allen | RB | $5,900 | 32.3 | 5.47 | 18.2% |
| Michael Wilson | WR | $6,400 | 34.3 | 5.36 | 25.5% |
| Sam LaPorta | TE | $6,000 | 28.5 | 4.75 | 8.2% |
| Isaiah Likely | TE | $5,300 | 24.9 | 4.70 | 7.4% |
| D’Andre Swift | RB | $6,500 | 30.3 | 4.66 | 11.9% |
| Jaylen Warren | RB | $6,700 | 30.9 | 4.61 | 13.7% |
| Tucker Kraft | TE | $5,600 | 23.8 | 4.25 | 5.8% |
Top value: Braelon Allen. His 32.3 SACP at $5,900 gives him the strongest salary-adjusted ceiling in this selected group.
Best midrange TE: Sam LaPorta. He provides 28.5 SACP with only 8.2% ownership.
Value caution: Michael Wilson. His ceiling-per-dollar is excellent, but 25.5% ownership makes him a popular value rather than a separator.
4. Best sleepers/right-tail separators
These are the most interesting lower-owned players for tournaments where first-place equity matters more than median outcomes.
| Player | Pos. | SACP | RST% | Right-Tail MME |
|---|---|---|---|---|
| Brock Purdy | QB | 31.5 | 1.1% | 89.3 |
| Jayden Daniels | QB | 31.4 | 1.2% | 86.6 |
| Bo Nix | QB | 31.6 | 2.3% | 64.9 |
| Jordan Love | QB | 31.5 | 2.7% | 60.6 |
| Minnesota Vikings | DST | 20.4 | 3.8% | 44.9 |
| George Kittle | TE | 27.7 | 5.9% | 38.4 |
| Brock Bowers | TE | 32.9 | 7.4% | 37.9 |
| Justin Jefferson | WR | 34.9 | 8.8% | 36.2 |
| Christian McCaffrey | RB | 36.3 | 9.7% | 34.4 |
Highest-priority separators
Brock Purdy: A 31.5 SACP at 1.1% ownership creates significant tournament leverage. His ceiling is lower than Goff’s, but his ownership is dramatically lower.
Jordan Love: At $7,400 with 2.7% ownership, Love offers a less expensive path to a low-owned quarterback stack.
Justin Jefferson: A premium receiver with 34.9 SACP and only 8.8% ownership. A compelling alternative to higher-owned spend-up receivers.
Brock Bowers: A 32.9 SACP at 7.4% ownership makes him a strong TE tournament option.
Right-Tail MME scores are separation indicators, not win probabilities. Low ownership alone does not make a player a strong tournament investment.
5. Top five game environments
The table below combines Vegas scoring expectations with the solver’s aggregate individual ceiling results.
| Rank | Game | O/U | Total SACP | Best opportunity |
|---|---|---|---|---|
| 1 | ARI–DET | 54.5 | 399.2 | Raw-ceiling stacks |
| 2 | CHI–GB | 45.5 | 353.4 | Love-led leverage |
| 3 | CIN–MIA | 42.5 | 343.4 | Burrow–Chase upside |
| 4 | SEA–SF | 46.5 | 343.0 | Purdy-led separation |
| 5 | LV–NE | 45.0 | 337.2 | Maye–Bowers correlation |
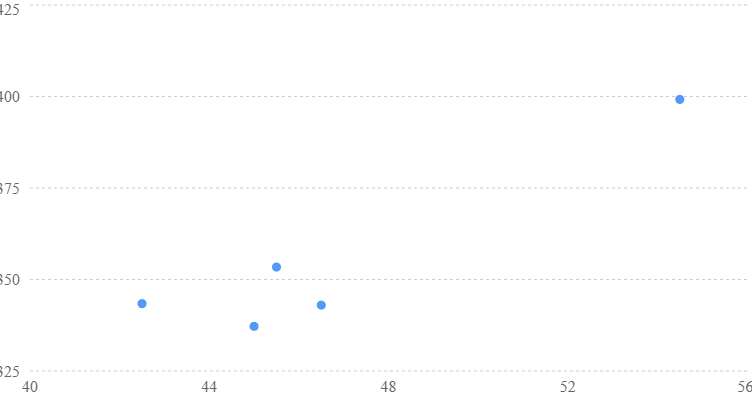
Upper-right games combine higher Vegas totals and higher summed player ceilings.
Environment interpretation
Arizona–Detroit: Strongest raw-ceiling game, supported by the highest Vegas total. The principal challenge is ownership concentration.
Chicago–Green Bay: An intriguing alternative with Love at 2.7% ownership and Watson at 14.7%. Offers a route to separation without paying for the most popular quarterback.
Cincinnati–Miami: My preferred premium QB leverage environment. Burrow and Chase combine for 76.1 SACP while carrying considerably less ownership than Detroit’s most popular pieces.
Seattle–San Francisco: Purdy at 1.1% ownership is the main separator. Kittle and McCaffrey provide additional San Francisco ceiling, while Smith-Njigba offers a premium opposing option.
Las Vegas–New England: Maye, Bowers and Jeanty create several ways to attack this environment without relying on the slate’s highest-owned players.
6. Best full onslaught/game-stack environments
A full onslaught uses multiple players from both teams, betting on a game that substantially exceeds scoring expectations. These are proposed correlation structures, not optimized or salary-validated complete lineups.
| Priority | Game | Stack structure | Strategic purpose |
|---|---|---|---|
| 1 | CIN–MIA | Burrow + Chase + Miami pass catcher | Premium leverage |
| 2 | ARI–DET | Goff + St. Brown + McBride | Maximum raw ceiling |
| 3 | SEA–SF | Purdy + Kittle + Smith-Njigba | Extreme QB separation |
| 4 | CHI–GB | Love + Watson + Swift | Contrarian shootout |
| 5 | LV–NE | Maye + NE receiver + Bowers | Balanced secondary stack |
My preferred onslaught: Cincinnati–Miami
The central thesis is that Burrow and Chase substantially outperform their median projections while the opposing offense generates enough scoring to sustain aggressive passing volume.
The game has a relatively modest 42.5 total, which makes this a contrarian game-script bet rather than the safest environment.
Highest raw-ceiling onslaught: Arizona–Detroit
Goff, St. Brown and McBride provide a strong passing-game construction. Gibbs can be incorporated as a premium RB, but combining multiple high-owned Detroit players requires differentiation elsewhere.
Highest-risk onslaught: Seattle–San Francisco
Purdy + Kittle + Smith-Njigba is an especially interesting GPP construction. It combines an extremely low-owned quarterback with an elite opposing WR ceiling.
7. Recommended bring-back structures
Bring-backs are most useful when the opposing player’s success helps sustain the offensive volume of the primary stack.
| Primary stack | Bring-back | Correlation rationale |
|---|---|---|
| Goff + St. Brown | Trey McBride | Arizona passing response |
| Burrow + Chase | Miami WR/TE | Opposing scoring sustains passing |
| Purdy + Kittle | Smith-Njigba | Seattle production encourages SF passing |
| Love + Watson | D’Andre Swift | Chicago production sustains game competitiveness |
| Maye + NE pass catcher | Brock Bowers | Raiders passing production |
| Arizona passing stack | St. Brown | Detroit passing ceiling |
Bring-back principles
- A single bring-back is generally sufficient for a conventional QB double stack.
- A double bring-back becomes more interesting when both offenses have multiple credible ceiling plays and the salary construction works.
- Running backs can serve as bring-backs, but their game-script correlation may be weaker than a high-volume receiver’s.
- Do not force a bring-back simply because a game has a high total. The opposing player must have a realistic ceiling path.
For this slate, McBride, Smith-Njigba and Bowers are particularly appealing opposing pieces based on their modeled SACP.
8. SE vs. 3-Max priorities
Single Entry and 3-Max require different approaches to variance and ownership.
| Decision | Single Entry | 3-Max |
|---|---|---|
| QB | Goff, Burrow, Maye | Burrow, Purdy, Love |
| RB anchors | Gibbs, Taylor | Gibbs, McCaffrey, Chase Brown |
| WR anchors | Smith-Njigba, St. Brown | Chase, Jefferson, Smith-Njigba |
| TE | McBride, LaPorta | Bowers, Kittle, McBride |
| Defense | Houston, Minnesota | Minnesota, Cincinnati, New England |
| Stack approach | Strong primary correlation | Diversified game scripts |
| Ownership approach | 1–2 meaningful separators | Multiple distinct leverage constructions |
Single Entry strategy
For Single Entry, I would prioritize the strongest raw-ceiling foundation while avoiding unnecessary risk.
Preferred structure: One premium anchor, a correlated QB stack, one lower-owned premium alternative and salary-efficient supporting players.
Goff’s raw ceiling makes him a legitimate option, but Burrow offers a way to capture substantial upside while avoiding the slate’s most popular quarterback.
3-Max strategy
I would divide three entries into distinct game-script bets:
Entry 1 — Raw-ceiling foundation
Balanced
Goff + St. Brown + McBride, with a premium RB anchor such as Gibbs if salary permits.
Entry 2 — Premium leverage
Contrarian
Burrow + Chase, with a Miami bring-back. Consider McCaffrey as a premium RB alternative.
Entry 3 — Right-tail attack
High variance
Purdy + Kittle + Smith-Njigba, supplemented by lower-owned ceiling plays at other positions.
These constructions represent different ways the slate could unfold rather than three versions of the same popular lineup.
9. Key fragile-chalk/fade considerations
High ownership is not inherently bad. The important question is whether the player’s ceiling advantage justifies the field’s exposure.
| Player | RST% | SACP | Concern | Recommendation |
|---|---|---|---|---|
| Gibbs | 42.2% | 52.2 | Extremely concentrated RB ownership | Keep as raw-ceiling anchor |
| Goff | 36.2% | 39.4 | Popular QB stack construction | Pivot selectively to Burrow |
| Brissett | 32.7% | 32.7 | High ownership relative to ceiling alternatives | Consider underweight |
| Smith-Njigba | 32.0% | 49.5 | Premium WR ownership | Retain exposure, vary stacks |
| St. Brown | 26.4% | 44.6 | Detroit stack concentration | Strong play, diversify combinations |
| Michael Wilson | 25.5% | 34.3 | Popular midrange value | Evaluate lower-owned alternatives |
| Washington DST | 21.9% | 20.2 | Ownership concentration at volatile position | Consider defensive pivots |
Three chalk decisions that matter most
1. Gibbs: I would not fade Gibbs simply because he is popular. His 52.2 SACP is significantly ahead of the RB field. The better approach may be to roster Gibbs while differentiating at quarterback or receiver.
2. Goff: This is a more compelling leverage decision. Burrow’s SACP is only 3.8 points lower, while projected ownership drops from 36.2% to 3.6%. That makes Burrow a meaningful tournament alternative.
3. Washington DST: Defense is inherently volatile. With Washington projected at 21.9% ownership, Houston, Cincinnati and Minnesota offer alternative ceiling paths at lower ownership.
The key is to avoid treating every popular player as fragile. A high-owned player with a substantial ceiling advantage may still be worth rostering.
10. Final condensed player pool and slate strategy
Recommended player pool
| Position | Primary targets | Leverage alternatives | Value options |
|---|---|---|---|
| QB | Goff, Burrow | Purdy, Love, Maye | Brissett |
| RB | Gibbs, Taylor | McCaffrey, Chase Brown, Jeanty | Allen, Swift, Warren |
| WR | Smith-Njigba, St. Brown | Chase, Jefferson, Collins | Michael Wilson |
| TE | McBride, Bowers | Kittle, LaPorta | Likely, Kraft |
| DST | Houston, Cincinnati | Minnesota, New England | Washington |
Final decision matrix
Best raw-ceiling player
Jahmyr Gibbs
Best premium WR pivot
Ja’Marr Chase
Best QB leverage
Joe Burrow
Best salary-adjusted value
Braelon Allen
Best contrarian QB
Brock Purdy
Best TE ceiling
Trey McBride
Best DST leverage
Minnesota Vikings
Final Diamond Life strategy
The slate offers two distinctly different paths.
The first is to embrace the raw-ceiling advantage of Arizona–Detroit, building around Gibbs, Goff and St. Brown while introducing carefully selected separators.
The second is to attack the ownership gap in alternative environments, especially Burrow–Chase and Purdy–Kittle, using premium players such as McCaffrey, Jefferson and Bowers to create a more differentiated lineup.
My preferred approach for 3-Max is to combine one raw-ceiling build with two genuinely different correlated leverage builds. This maintains exposure to the strongest game environment without requiring all three entries to succeed under the same game script.


Leave a Reply