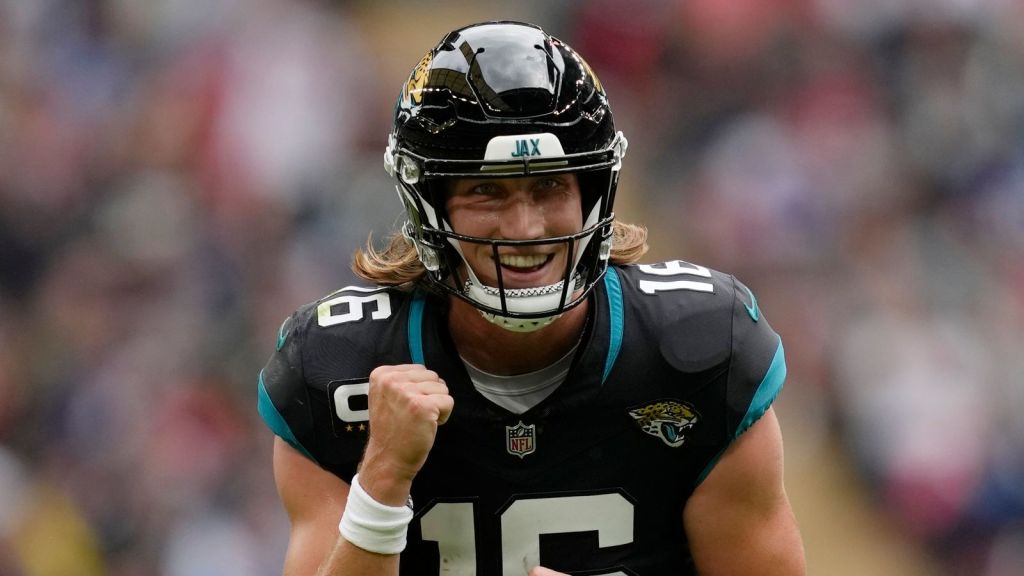
Diamond Life DFS Casino Solves NFL Week 3 – Deeper Dive!
NFL Week 3 MAIN DK Breakdown
The full Diamond Life NFL run points to a slate with multiple viable game environments rather than one mandatory stack. BAL–DAL carries the strongest combination of game total and two-sided ceiling, while BUF–LAC stands out because its ownership remains unusually reasonable relative to the environment. SF–ARI offers one of the cleanest concentrated stack structures through Purdy/CMC/Kittle with McBride coming back.
For tournaments, the more interesting discovery is that we don’t have to abandon strong environments to gain leverage. DAL’s side of BAL–DAL, JAX–NE, and the lower-owned pieces of DET–NYJ give us ways to attack ceiling outcomes from positions the field is less concentrated on. That makes this a slate where I favor ceiling-preserving leverage rather than low-owned plays simply for the sake of ownership.
– Top solver plays by position
Quarterback
| Rank | QB | Salary | RST% | P99 | SACP | Tail Lev |
|---|---|---|---|---|---|---|
| 1 | Lamar Jackson | $7,500 | 10.3% | 36.01 | 36.06 | 10.60 |
| 2 | Josh Allen | $8,000 | 5.6% | 35.37 | 35.52 | 14.10 |
| 3 | Brock Purdy | $6,500 | 6.2% | 32.80 | 33.02 | 12.41 |
| 4 | Patrick Mahomes | $6,200 | 5.8% | 31.31 | 31.69 | 12.29 |
| 5 | Jalen Hurts | $6,800 | 2.3% | 28.82 | 29.20 | 17.90 |
| 6 | Trevor Lawrence | $5,700 | 6.3% | 28.18 | 28.61 | 10.63 |
| 7 | Dak Prescott | $6,700 | 2.1% | 27.97 | 28.42 | 18.27 |
| 8 | Drake Maye | $6,100 | 1.9% | 27.72 | 28.31 | 19.00 |
| 9 | Kyler Murray | $5,100 | 6.5% | 27.65 | 28.09 | 10.20 |
| 10 | Tyler Shough | $5,400 | 6.0% | 27.26 | 27.68 | 10.51 |
Read: Lamar wins raw ceiling, but Allen and Purdy retain enormous ceiling at lower ownership. Hurts/Dak/Maye become the aggressive separator tier.
Running Back
| Rank | RB | Salary | RST% | P99 | SACP | Tail Lev |
|---|---|---|---|---|---|---|
| 1 | Jahmyr Gibbs | $8,800 | 29.7% | 34.57 | 34.58 | 5.98 |
| 2 | Christian McCaffrey | $8,300 | 28.4% | 31.25 | 31.33 | 5.52 |
| 3 | Kenneth Walker | $7,400 | 59.0% | 31.08 | 31.19 | 3.81 |
| 4 | Bijan Robinson | $8,700 | 3.9% | 29.74 | 30.13 | 14.23 |
| 5 | Jonathan Taylor | $7,600 | 5.3% | 28.39 | 28.85 | 11.69 |
| 6 | Derrick Henry | $7,700 | 8.9% | 26.66 | 26.82 | 8.47 |
| 7 | De’Von Achane | $6,500 | 3.9% | 25.50 | 26.00 | 12.14 |
| 8 | Chase Brown | $6,600 | 7.2% | 24.99 | 25.35 | 8.76 |
| 9 | Ashton Jeanty | $7,100 | 2.2% | 24.34 | 24.79 | 15.41 |
| 10 | Bucky Irving | $6,300 | 3.1% | 23.46 | 23.85 | 12.47 |
Read: Bijan is the standout leverage spend-up. Walker is good chalk analytically, but 59% RST creates significant opportunity cost.
Wide Receiver
| Rank | WR | Salary | RST% | P99 | SACP | RT MME |
|---|---|---|---|---|---|---|
| 1 | Jaxon Smith-Njigba | $8,600 | 21.9% | 40.65 | 39.72 | 4.53 |
| 2 | Amon-Ra St. Brown | $7,900 | 16.9% | 29.97 | 29.91 | 3.72 |
| 3 | Chris Olave | $7,200 | 13.8% | 28.01 | 28.01 | 3.86 |
| 4 | CeeDee Lamb | $7,800 | 8.5% | 27.61 | 27.59 | 3.63 |
| 5 | Zay Flowers | $6,900 | 17.2% | 27.39 | 27.28 | 3.86 |
| 6 | Parker Washington | $6,000 | 13.2% | 26.63 | 26.55 | 4.35 |
| 7 | Justin Jefferson | $7,500 | 8.4% | 26.10 | 26.37 | 3.61 |
| 8 | Ja’Marr Chase | $8,100 | 7.2% | 26.13 | 26.34 | 3.39 |
| 9 | DeVonta Smith | $7,100 | 7.1% | 25.35 | 25.48 | 3.73 |
| 10 | Christian Watson | $6,400 | 11.4% | 24.60 | 24.70 | 3.87 |
Read: JSN is the clearest positional ceiling outlier on the slate. His 40.65 P99 materially separates from the WR field.
Tight End
| Rank | TE | Salary | RST% | P99 | SACP | Tail Lev |
|---|---|---|---|---|---|---|
| 1 | Trey McBride | $6,700 | 6.8% | 27.56 | 27.76 | 9.84 |
| 2 | Brock Bowers | $6,600 | 2.6% | 21.76 | 22.10 | 12.59 |
| 3 | Dalton Kincaid | $5,500 | 5.9% | 21.42 | 21.38 | 8.13 |
| 4 | George Kittle | $4,800 | 7.4% | 20.54 | 20.63 | 6.98 |
| 5 | Sam LaPorta | $4,300 | 10.6% | 19.31 | 19.51 | 5.52 |
| 6 | Dalton Schultz | $4,200 | 4.8% | 19.12 | 19.46 | 8.10 |
| 7 | Travis Kelce | $4,500 | 5.9% | 19.05 | 19.23 | 7.28 |
| 8 | Mark Andrews | $4,400 | 10.6% | 18.97 | 19.12 | 5.42 |
| 9 | Tucker Kraft | $4,900 | 4.2% | 17.78 | 18.22 | 8.15 |
| 10 | Tyler Warren | $5,300 | 0.8% | 17.11 | 17.43 | 17.76 |
Read: McBride owns the ceiling advantage. Bowers offers the strongest combination of premium ceiling and low ownership.
Defense
| Rank | DST | Salary | RST% | P99 | SACP | RT MME |
|---|---|---|---|---|---|---|
| 1 | Seattle | $3,800 | 3.4% | 16.89 | 17.00 | 4.80 |
| 2 | Kansas City | $3,700 | 3.6% | 16.87 | 16.94 | 4.87 |
| 3 | Philadelphia | $3,200 | 5.5% | 16.45 | 16.70 | 5.31 |
| 4 | Green Bay | $3,500 | 3.0% | 15.79 | 16.11 | 4.97 |
| 5 | San Francisco | $3,600 | 2.6% | 15.96 | 16.01 | 4.90 |
| 6 | NY Giants | $3,400 | 3.1% | 15.55 | 15.87 | 5.03 |
| 7 | Carolina | $3,000 | 4.6% | 15.38 | 15.68 | 5.39 |
| 8 | Cincinnati | $2,900 | 2.7% | 14.12 | 14.45 | 5.41 |
| 9 | Minnesota | $3,100 | 3.8% | 13.30 | 13.59 | 4.60 |
| 10 | Detroit | $3,500 | 2.3% | 13.34 | 13.51 | 4.29 |
– Best spend-ups
| Player | Pos | Salary | RST% | SACP | Why |
|---|---|---|---|---|---|
| JSN | WR | $8,600 | 21.9% | 39.72 | Slate-leading skill-position ceiling |
| Lamar Jackson | QB | $7,500 | 10.3% | 36.06 | Highest QB SACP |
| Josh Allen | QB | $8,000 | 5.6% | 35.52 | Nearly Lamar ceiling at lower ownership |
| Jahmyr Gibbs | RB | $8,800 | 29.7% | 34.58 | Highest RB ceiling |
| CMC | RB | $8,300 | 28.4% | 31.33 | Elite individual ceiling/correlation |
| Bijan Robinson | RB | $8,700 | 3.9% | 30.13 | Outstanding premium leverage |
| Trey McBride | TE | $6,700 | 6.8% | 27.76 | Large TE ceiling advantage |
| CeeDee Lamb | WR | $7,800 | 8.5% | 27.59 | Premium ceiling inside best environment |
Tournament standout: Bijan. His 30.13 SACP is extremely close to the chalk premium backs while his 3.9% RST is radically different.
– Best values
| Player | Pos | Salary | RST% | P99 | SACP | Role |
|---|---|---|---|---|---|---|
| Kyler Murray | QB | $5,100 | 6.5% | 27.65 | 28.09 | Salary-release QB |
| Tyler Shough | QB | $5,400 | 6.0% | 27.26 | 27.68 | Cheap QB ceiling |
| Trevor Lawrence | QB | $5,700 | 6.3% | 28.18 | 28.61 | Value + correlation |
| Jeremiyah Love | RB | $5,500 | 6.0% | 22.89 | 23.41 | RB salary relief |
| Parker Washington | WR | $6,000 | 13.2% | 26.63 | 26.55 | High-ceiling mid-tier WR |
| Jalen Coker | WR | $5,500 | 14.6% | 24.13 | 24.19 | WR salary relief |
| George Kittle | TE | $4,800 | 7.4% | 20.54 | 20.63 | Strong TE price point |
| Sam LaPorta | TE | $4,300 | 10.6% | 19.31 | 19.51 | Cheap access to DET |
| Dalton Schultz | TE | $4,200 | 4.8% | 19.12 | 19.46 | Value + ownership |
| Hunter Henry | TE | $3,900 | 4.7% | 16.82 | 17.21 | Cheap Maye correlation |
Kyler is especially useful if the goal is to convert QB salary directly into multiple premium skill-position ceilings.
– Best sleepers/right-tail separators
| Player | Pos | RST% | P99 | SACP | Tail Lev | Separator Case |
|---|---|---|---|---|---|---|
| Drake Maye | QB | 1.9% | 27.72 | 28.31 | 19.00 | Elite QB leverage |
| Dak Prescott | QB | 2.1% | 27.97 | 28.42 | 18.27 | Leverage side of BAL–DAL |
| Jalen Hurts | QB | 2.3% | 28.82 | 29.20 | 17.90 | Premium QB at sleeper ownership |
| Bijan Robinson | RB | 3.9% | 29.74 | 30.13 | 14.23 | Elite RB without elite ownership |
| Jonathan Taylor | RB | 5.3% | 28.39 | 28.85 | 11.69 | Strong Walker alternative |
| De’Von Achane | RB | 3.9% | 25.50 | 26.00 | 12.14 | Volatility/right-tail play |
| Ashton Jeanty | RB | 2.2% | 24.34 | 24.79 | 15.41 | Low-owned RB ceiling |
| Garrett Wilson | WR | 4.6% | 23.79 | 24.21 | 10.40 | DET bring-back leverage |
| Brock Bowers | TE | 2.6% | 21.76 | 22.10 | 12.59 | Premium TE separator |
| Tyler Warren | TE | 0.8% | 17.11 | 17.43 | 17.76 | Deep GPP separator |
Maye, Dak, Bijan and Bowers are especially useful because their low ownership is accompanied by legitimate ceiling rather than simply being contrarian.
– Top five game environments
| Rank | Game | Total | Solver Thesis |
|---|---|---|---|
| 1 | BAL–DAL | 53.5 | Highest total + strong two-sided ceilings |
| 2 | BUF–LAC | 50.0 | Elite Allen ceiling with attractive ownership |
| 3 | SF–ARI | 48.5 | Purdy/CMC + elite McBride bring-back |
| 4 | DET–NYJ | 47.5 | DET ceiling; NYJ provides leverage |
| 5 | JAX–NE | 46.0 | Best sleeper/right-tail environment |
BAL–DAL has the strongest conventional shootout profile. BUF–LAC may be even more attractive from an ownership-adjusted tournament perspective.
JAX–NE is the game whose solver ceiling exceeds what its surface-level popularity is likely to imply.
– Best full onslaught/game-stack environments
| Priority | Stack | Bring-Back | Tournament Thesis |
|---|---|---|---|
| 1 | Lamar + Flowers + BAL2 | CeeDee/Pickens | Highest raw game ceiling |
| 2 | Allen + BUF1 + Kincaid | McConkey/Hampton | Ceiling + ownership leverage |
| 3 | Purdy + SF1 + Kittle/CMC | McBride | Concentrated ceiling |
| 4 | Lawrence + Washington + JAX2 | Henry/NE1 | Low-owned full-game bet |
| 5 | Goff + Amon-Ra + DET2 | Garrett Wilson | Asymmetric ownership |
| Contrarian | Dak + CeeDee + Pickens | Flowers | Reverse BAL–DAL onslaught |
The Dak-led reverse BAL–DAL stack deserves special attention for larger-field play. You’re attacking the same slate-leading 53.5 environment but starting from the side carrying dramatically less QB ownership.
– Recommended bring-back structures
| Primary Stack | Preferred Bring-Back | Secondary | Aggressive Double |
|---|---|---|---|
| BAL | CeeDee | Pickens | CeeDee + Pickens |
| DAL | Flowers | Henry | Flowers + Henry |
| BUF | McConkey | Hampton | McConkey + Hampton |
| LAC | BUF pass catcher | Kincaid | BUF WR + Kincaid |
| SF | McBride | ARI skill player | McBride + ARI2 |
| DET | Garrett Wilson | Breece | Wilson + Breece |
| JAX | Hunter Henry | NE skill player | Henry + NE2 |
| NE | Parker Washington | JAX skill player | Washington + JAX2 |
The default remains QB + 2 + one bring-back. Double bring-backs are better reserved for explicit shootout bets rather than forced into every lineup.
– SE vs. 3-Max priorities
| Component | Single Entry | 3-Max |
|---|---|---|
| QB | Lamar / Allen / Purdy | Allen / Purdy / Dak / Maye |
| Premium RB | Gibbs / CMC | Bijan / JT / Achane |
| Premium WR | JSN / Amon-Ra | JSN / CeeDee / Chase |
| TE | McBride / Kittle | McBride / Bowers / Schultz |
| Game | BAL–DAL / BUF–LAC | BUF–LAC / DAL→BAL / JAX–NE |
| Correlation | QB + 1/2 + bring-back | QB + 2 + bring-back |
| Ownership approach | Ceiling first | Ceiling-preserving leverage |
For SE, there’s little reason to get unnecessarily exotic. The solver gives us enough ceiling from strong environments.
For 3-Max, we can take stronger stands around Bijan/JT instead of concentrated RB chalk, Dak/Maye QB stacks, Bowers at TE, and reverse game constructions.
– Key fragile-chalk/fade considerations
Kenneth Walker — 59% RST
This is easily the most consequential ownership decision.
Walker is not bad chalk:
31.19 SACP / 31.08 P99.
The concern is his 3.81 Tail Leverage, compared with:
| RB | RST% | SACP | Tail Leverage |
|---|---|---|---|
| Walker | 59.0% | 31.19 | 3.81 |
| Gibbs | 29.7% | 34.58 | 5.98 |
| CMC | 28.4% | 31.33 | 5.52 |
| Bijan | 3.9% | 30.13 | 14.23 |
| Jonathan Taylor | 5.3% | 28.85 | 11.69 |
| Achane | 3.9% | 26.00 | 12.14 |
This is an important distinction: Walker can be a strong projection and still create tournament opportunity elsewhere.
Gibbs and CMC also carry substantial ownership, but their raw ceilings make their concentration easier to justify.
JSN’s 21.9% shouldn’t automatically concern us either because his 39.72 SACP/40.65 P99 represents a much larger positional ceiling advantage.
– Final condensed player pool and slate strategy
Condensed Diamond Life Pool
| Position | Core Ceiling | Leverage | Value |
|---|---|---|---|
| QB | Lamar, Allen, Purdy | Dak, Maye, Hurts | Kyler, Lawrence |
| RB | Gibbs, CMC | Bijan, JT, Achane, Jeanty | Love, Bucky |
| WR | JSN, Amon-Ra, CeeDee | Chase, Jefferson, Garrett Wilson | Parker Washington, Coker |
| TE | McBride | Bowers, Schultz | Kittle, LaPorta, Henry |
| DST | SEA, KC | SF, GB | PHI, CAR, CIN |
The slate’s central construction question is where to accept ownership. JSN is expensive and moderately popular, but his simulation ceiling is sufficiently different from the WR field that the ownership is supported by the analytics. Walker presents a different decision because there are multiple RB alternatives retaining substantial P99/SACP at a fraction of his 59% RST.
For SE, I’d build around strong raw-ceiling environments—particularly BAL–DAL, BUF–LAC and SF–ARI—and obtain differentiation through one or two strong leverage pieces rather than constructing an entirely contrarian lineup.
For 3-Max, the solver provides more freedom to attack Allen-led BUF stacks, the low-owned Dallas side of BAL–DAL, Bijan/JT/Achane at RB, Bowers at TE, and JAX–NE as the sleeper game environment.
The strongest overarching Diamond Life signal is that this slate doesn’t require sacrificing projection to become different. There are legitimate P95/P99 ceilings sitting at low ownership. Building around those ceiling-preserving separators, while maintaining strong game correlation, is the cleanest way to exploit the current ownership structure.
NFL Week 3 MAIN FD Breakdown
The slate has a strong mix of obvious premium environments and unusually attractive low-owned right-tail paths. BAL–DAL is the defining raw-scoring game, but the solver is not telling us that we need to live entirely in the chalkiest environment. SF–ARI and DET–NYJ offer strong concentrated ceilings, while JAX–NE is the clearest environment where the SACP/right-tail results are materially stronger than field ownership suggests.
At the player level, Lamar Jackson and Josh Allen dominate QB ceiling, while Gibbs and JSN are especially attractive premium skill-position pieces because their ownership is considerably lower than Lamar’s. The most interesting tournament finding remains the Lawrence–Parker Washington correlation, while Skattebo, Andrews, Kincaid and Bateman give us ways to create salary and ownership separation.
One ownership-modeling note matters: where defensive RST% was missing, I’ve applied our new NFL DEF fallback—5% for $4,000+ defenses and 1% below $4,000—rather than treating those defenses as literally 0% owned.
– Top solver plays by position
QB
| Rank | QB | Salary | RST% | P95 | P99 | SACP | Solver Read |
|---|---|---|---|---|---|---|---|
| 1 | Lamar Jackson | $8,600 | 33.3% | 37.08 | 43.66 | 39.42 | Highest raw SACP |
| 2 | Josh Allen | $9,100 | 20.3% | 36.94 | 43.77 | 39.23 | Elite ceiling, ownership discount |
| 3 | Brock Purdy | $8,200 | — | 33.21 | 39.03 | 35.81 | Strong SF environment |
| 4 | Patrick Mahomes | $8,100 | 9.1% | 31.72 | 37.08 | 33.96 | Premium leverage QB |
| 5 | Drake Maye | $7,400 | 1.5% | 29.60 | 35.17 | 31.89 | Value/right-tail QB |
| 6 | Trevor Lawrence | $7,700 | 0.1% | 29.26 | 34.24 | 31.56 | Extreme leverage |
| 7 | Kyler Murray | $7,000 | — | 28.26 | — | 30.89 | Salary-adjusted upside |
| 8 | Tyler Shough | $7,500 | — | 28.07 | — | 30.68 | Deep separator |
| 9 | Dak Prescott | $8,300 | 0.9% | 28.38 | 33.33 | 30.66 | BAL game leverage |
| 10 | Drew Lock | $6,900 | — | 27.24 | — | 29.93 | Deep tournament option |
QB takeaway: Lamar is the raw projection/ceiling play, but Allen, Mahomes, Maye and Lawrence offer increasingly aggressive ownership alternatives.
RB
| Rank | RB | Salary | RST% | P95 | P99 | SACP |
|---|---|---|---|---|---|---|
| 1 | Jahmyr Gibbs | $9,200 | 10.5% | 33.46 | 40.03 | 35.78 |
| 2 | Christian McCaffrey | $8,900 | 22.0% | 29.37 | 35.00 | 31.57 |
| 3 | Kenneth Walker | $8,300 | — | 28.82 | 34.05 | 31.39 |
| 4 | Jonathan Taylor | $8,500 | 11.9% | 27.16 | — | 29.29 |
| 5 | Derrick Henry | $9,000 | 7.4% | 27.12 | — | 29.26 |
| 6 | James Cook | $8,100 | 8.7% | 24.25 | — | 26.34 |
| 7 | Cam Skattebo | $6,900 | 0.9% | 23.80 | 29.05 | 25.93 |
| 8 | Ashton Jeanty | $7,700 | 5.5% | 22.93 | — | 25.04 |
| 9 | Javonte Williams | $7,300 | 8.2% | 22.86 | — | 24.96 |
| 10 | Jeremiyah Love | $5,800 | — | 22.41 | — | 24.88 |
RB takeaway: Gibbs is the standout. His combination of 35.78 SACP, 40.03 P99 and only 10.5% RST makes him one of the slate’s strongest premium tournament pieces.
WR
| Rank | WR | Salary | RST% | P95 | P99 | SACP |
|---|---|---|---|---|---|---|
| 1 | Jaxon Smith-Njigba | $9,200 | 10.7% | 32.83 | 38.72 | 35.12 |
| 2 | Parker Washington | $7,100 | 0.1% | 28.37 | 36.51 | 30.89 |
| 3 | Amon-Ra St. Brown | $9,000 | 13.0% | 23.78 | — | 25.73 |
| 4 | CeeDee Lamb | $8,600 | 18.9% | 22.42 | — | 24.37 |
| 5 | Chris Olave | $8,100 | 5.0% | 22.36 | — | 24.32 |
| 6 | Zay Flowers | $7,500 | 15.7% | 22.12 | — | 24.02 |
| 7 | Justin Jefferson | $8,400 | 12.0% | 20.69 | — | 22.54 |
| 8 | Ja’Marr Chase | $8,900 | 11.2% | 20.62 | — | 22.44 |
| 9 | Garrett Wilson | $7,300 | 11.0% | 19.19 | — | 21.01 |
| 10 | George Pickens | $7,700 | 3.2% | 18.95 | 22.27 | 20.77 |
The WR position contains the slate’s most unusual result: Parker Washington ranks #2 in SACP despite 0.1% projected ownership.
TE
| Rank | TE | Salary | RST% | P95 | SACP | Read |
|---|---|---|---|---|---|---|
| 1 | Trey McBride | $7,300 | 9.8% | 20.08 | 21.99 | Raw TE leader |
| 2 | Mark Andrews | $5,300 | 6.1% | 18.06 | 19.99 | Excellent salary/ceiling |
| 3 | George Kittle | $6,100 | — | 16.60 | 18.66 | SF correlation |
| 4 | Dalton Kincaid | $5,700 | 2.7% | 16.61 | 18.47 | Low-owned Allen partner |
| 5 | Hunter Henry | $5,100 | 4.1% | 16.55 | 18.36 | Value |
| 6 | Brock Bowers | $6,500 | 10.5% | 16.35 | 18.13 | Strong raw play |
| 7 | Sam LaPorta | $6,200 | 7.5% | 14.89 | 16.47 | DET correlation |
| 8 | Travis Kelce | $5,500 | 8.0% | 14.51 | 16.14 | Mahomes correlation |
| 9 | Dalton Schultz | $5,800 | 2.6% | 14.28 | 15.98 | Separator |
| 10 | T.J. Hockenson | $5,100 | 5.9% | 13.59 | 15.27 | Salary saver |
– Best spend-ups
| Priority | Player | Pos | Salary | RST% | SACP | Why |
|---|---|---|---|---|---|---|
| 1 | Josh Allen | QB | $9,100 | 20.3% | 39.23 | Near-Lamar ceiling at lower ownership |
| 2 | Jahmyr Gibbs | RB | $9,200 | 10.5% | 35.78 | Elite P99 + moderate ownership |
| 3 | JSN | WR | $9,200 | 10.7% | 35.12 | Clear WR ceiling leader |
| 4 | Lamar Jackson | QB | $8,600 | 33.3% | 39.42 | Highest SACP on slate |
| 5 | Christian McCaffrey | RB | $8,900 | 22.0% | 31.57 | SF scoring correlation |
| 6 | Derrick Henry | RB | $9,000 | 7.4% | 29.26 | Lower-owned premium RB |
| 7 | Chris Olave | WR | $8,100 | 5.0% | 24.32 | Spend-up WR leverage |
Gibbs and JSN are particularly useful premium building blocks because neither requires accepting 20–30%+ ownership.
– Best values
| Player | Pos | Salary | RST% | SACP | Value Case |
|---|---|---|---|---|---|
| Drake Maye | QB | $7,400 | 1.5% | 31.89 | Cheap QB ceiling |
| Cam Skattebo | RB | $6,900 | 0.9% | 25.93 | Major salary/ownership combination |
| Jeremiyah Love | RB | $5,800 | — | 24.88 | Premium salary release |
| Mark Andrews | TE | $5,300 | 6.1% | 19.99 | Strong P99 access for price |
| Dalton Kincaid | TE | $5,700 | 2.7% | 18.47 | Leverage + correlation |
| Hunter Henry | TE | $5,100 | 4.1% | 18.36 | Cheap right-tail access |
Skattebo and Andrews are particularly useful because they can finance the Gibbs/JSN/elite-QB tier without abandoning right-tail upside.
– Best sleepers/right-tail separators
| Player | Pos | RST% | P95 | P99 | SACP | Separator Case |
|---|---|---|---|---|---|---|
| Parker Washington | WR | 0.1% | 28.37 | 36.51 | 30.89 | Slate-breaking WR differential |
| Trevor Lawrence | QB | 0.1% | 29.26 | 34.24 | 31.56 | Stack correlation with Washington |
| Drake Maye | QB | 1.5% | 29.60 | 35.17 | 31.89 | Low-owned QB ceiling |
| Dak Prescott | QB | 0.9% | 28.38 | 33.33 | 30.66 | Reverse BAL stack |
| Cam Skattebo | RB | 0.9% | 23.80 | 29.05 | 25.93 | RB separator |
| George Pickens | WR | 3.2% | 18.95 | 22.27 | 20.77 | BAL–DAL leverage |
| Rashod Bateman | WR | 2.4% | 18.31 | 23.47 | 20.33 | Cheap Lamar correlation |
| Dalton Kincaid | TE | 2.7% | 16.61 | 20.03 | 18.47 | Allen stack separator |
Lawrence–Washington is the slate’s strongest pure leverage correlation from the model.
– Top five game environments
| Rank | Game | Total | Solver Thesis |
|---|---|---|---|
| 1 | BAL–DAL | 53.5 | Best raw shootout environment |
| 2 | SF–ARI | 48.0 | Strong favorite + viable bring-back |
| 3 | DET–NYJ | 47.5 | Concentrated DET ceiling |
| 4 | JAX–NE | 46.0 | Best ownership-adjusted right-tail game |
| 5 | KC–MIA | 46.0 | Mahomes leverage + 28.5 KC implied total |
BAL–DAL is the game most likely to attract obvious stacking attention, but the solver’s differentiated environment is JAX–NE.
– Best full onslaught/game-stack environments
| Game | Core | Bring-Back | Preferred Construction |
|---|---|---|---|
| BAL–DAL | Lamar + Flowers + Andrews | Lamb/Pickens | 3+1 / 3+2 |
| JAX–NE | Lawrence + Washington + JAX piece | NE skill player | 3+1 / aggressive 4+1 |
| SF–ARI | Purdy + SF catcher + CMC | McBride | 3+1 |
| DET–NYJ | Goff + Amon-Ra + Gibbs | NYJ skill player | 3+1 |
| KC–MIA | Mahomes + two KC catchers | MIA receiver | 3+1 |
BAL–DAL is the raw-ceiling onslaught. JAX–NE is the right-tail ownership onslaught.
– Recommended bring-back structures
| Primary Stack | Preferred Bring-Back | Logic |
|---|---|---|
| Lamar + BAL 2 | Lamb / Pickens | Captures DAL response to BAL ceiling |
| Dak + DAL 2 | Flowers / Andrews | Contrarian access to 53.5 total |
| Purdy + SF 2 | McBride | Strong ARI concentrated target |
| Lawrence + JAX 2 | NE pass catcher | Keeps Lawrence throwing |
| Maye + NE 2 | Parker Washington | Captures Washington’s extreme P99 |
| Goff + DET 2 | NYJ receiver | Extends DET passing script |
| Mahomes + KC 2 | MIA receiver | Helps prevent KC blowout/run-out-clock script |
| Allen + BUF 2 | LAC receiver | Supports Allen’s extreme passing/rushing ceiling |
– SE vs. 3-Max priorities
Single Entry
I’d build SE around high-confidence ceiling with one or two meaningful separators, rather than forcing an entirely contrarian lineup.
The strongest structural concepts are:
Allen/Lamar + correlated stack → Gibbs/JSN premium piece → Skattebo/Andrews-type salary separator.
BAL–DAL and SF–ARI are the strongest foundational environments. One low-owned correlated player can create sufficient differentiation without sacrificing the entire projection base.
3-Max
3-Max gives us room to attack three different slate outcomes:
| Build | QB/Game | Philosophy |
|---|---|---|
| 1 | Lamar/Allen | Premium ceiling |
| 2 | Purdy/Mahomes | Strong environment + ownership reduction |
| 3 | Lawrence/Maye | Aggressive right-tail leverage |
That third lineup is where JAX–NE deserves exposure. Rather than randomly selecting low-owned players, we’re concentrating leverage around an internally correlated game outcome.
– Key fragile-chalk/fade considerations
Lamar Jackson (33.3%) isn’t weak chalk—the simulation actually validates him. The issue is opportunity cost. Allen’s SACP is virtually identical (39.23 vs. 39.42) at substantially lower ownership.
CMC (22%) is similarly strong rather than bad chalk, but Gibbs has a materially higher simulated SACP/P99 profile at roughly half the ownership.
CeeDee Lamb (18.9%) sits inside the slate’s best game environment, so his ownership makes sense. Pickens provides a lower-owned route into the same Dallas scoring script.
The important distinction is fragile construction versus fragile player. Several popular players have good individual simulations. The greater tournament concern is building the exact same combination of high-owned pieces as the field.
Also, don’t treat missing/zero RST% as genuine zero ownership. That’s particularly important with some players in this dataset. The solver’s right-tail result remains informative, but the apparent ownership leverage should be treated more cautiously.
– Final condensed player pool and slate strategy
Condensed Pool
| Position | Core Ceiling | Leverage/Value |
|---|---|---|
| QB | Lamar, Allen | Purdy, Mahomes, Maye, Lawrence, Dak |
| RB | Gibbs, CMC, Henry | Skattebo, Love, Walker |
| WR | JSN, Amon-Ra, Lamb, Olave, Flowers | Parker Washington, Pickens, Bateman |
| TE | McBride | Andrews, Kincaid, Henry, Kittle |
| DEF | SEA, KC | CAR, CIN, NO |
The DEF model now produces a useful distinction. SEA/KC remain raw-ceiling defenses, but after applying our 5% missing-ownership assumption, they no longer receive artificial zero-owned leverage. Carolina at $3,800/1% fallback ownership is particularly interesting, with a 24.02 SACP, 21.58 P95 and 28.61 P99.
Overall Slate Strategy
The solver is giving us a compelling stars + correlated separators slate.
I wouldn’t interpret the analytics as requiring us to fade the best plays simply because they’re popular. Instead, Gibbs and JSN provide premium ceiling at manageable ownership, while Andrews, Skattebo and other values create the salary necessary to reach them.
At QB, there are three distinct routes: Lamar/Allen for elite raw ceiling; Purdy/Mahomes for a middle-ground combination of ceiling and differentiation; Lawrence/Maye/Dak for aggressive tournament separation.
And the most interesting game-theory finding remains JAX–NE. Lawrence + Parker Washington isn’t simply two low-owned players thrown together—the simulation shows strong individual right tails within the same correlated game environment. That’s a much more compelling form of leverage.
For SE, I’d emphasize BAL–DAL/SF–ARI with controlled differentiation. For 3-Max, I’d deliberately diversify game scripts and reserve one construction for the JAX–NE right-tail scenario, rather than creating three slight variations of the same chalk build.


Leave a comment