
Diamond Life NHL DFS — Complete Slate Edge Report
November 19, 2026 | Rotowire Slate (82) | Vegas + Monte Carlo + Adjusted Ownership
After reviewing the uploaded NHL slate and Diamond Life Solver workbook, the strongest opportunity is finding teams with favorable Vegas implied scoring, strong simulated player ceilings, and ownership that hasn’t fully caught up.
The most important takeaway: Colorado, Minnesota, Seattle, and Ottawa provide the most interesting combinations of scoring environment, ceiling, and tournament leverage. Tampa Bay also deserves serious attention because of its 4.0 implied goals and Kucherov’s premium ceiling.
1. Top game environments — Vegas versus Solver
These are the leading environments based on uploaded Vegas implied goals, top-six skater SACP, and adjusted ownership.
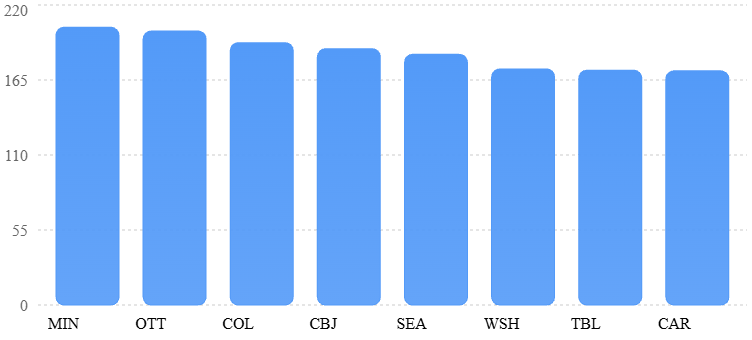
| Team | Vegas implied goals | Top-six SACP | Best opportunity |
|---|---|---|---|
| Colorado | 4.00 | 192.4 | Premium leverage |
| Minnesota | 3.75 | 203.7 | Highest team ceiling pool |
| Ottawa | 3.50 | 200.9 | Balanced ceiling/value |
| Seattle | 4.00 | 183.8 | Low-owned value |
| Columbus | 3.75 | 187.9 | Defense + scoring |
| Tampa Bay | 4.00 | 172.2 | Kucherov-led upside |
| Carolina | 4.00 | 171.7 | Alternative scoring stack |
| Washington | 4.00 | 173.1 | Secondary stack opportunity |
Top-six SACP is the sum of the six highest-ranked skaters on each team, not a projection of actual team fantasy points. Vegas values come from the uploaded slate, not a live odds refresh.
Where Vegas and the Solver agree
Top-six modeled ceiling for teams with at least 3.5 implied goals
What stands out
Colorado: Vegas expects four goals, and the solver sees significant individual ceiling. Necas provides one of the best premium leverage opportunities.
Minnesota: Its 3.75 implied goals are slightly below Colorado’s, but Minnesota leads the slate in combined top-six SACP. That creates a compelling case for concentrated offensive stacking.
Seattle: Four implied goals, meaningful modeled ceiling, and affordable low-owned options. This is one of the most interesting ways to construct a different tournament lineup.
Ottawa: Only 3.5 implied goals, yet its aggregate top-six ceiling nearly matches Minnesota’s. This is exactly the kind of discrepancy worth investigating in GPPs.
2. Best ceiling plays
| Player | SACP | Adj. own% | Vegas team goals |
|---|---|---|---|
| Connor McDavid | 47.8 | 19.2% | 2.50 |
| Nikita Kucherov | 45.1 | 10.4% | 4.00 |
| Kirill Kaprizov | 43.1 | 10.2% | 3.75 |
| Leon Draisaitl | 42.8 | 9.1% | 2.50 |
| Martin Necas | 41.9 | 7.5% | 4.00 |
| Tim Stützle | 41.4 | 8.8% | 3.50 |
| Matthew Boldy | 41.4 | 9.2% | 3.75 |
| Zach Werenski | 41.1 | 15.3% | 3.75 |
My preferred premium tournament plays
1. Nikita Kucherov — Tampa Bay
Best premium Vegas alignment
45.1 SACP, 4.0 implied team goals, and only 10.4% adjusted ownership. Excellent combination of scoring environment and modeled individual upside.
Aktuelle Eishockey Top-Scorer Statistik der NHL
2. Martin Necas — Colorado
41.9 SACP, 4.0 implied goals, and 7.5% ownership. Arguably the best premium leverage play when comparing ceiling to ownership.
3. Kirill Kaprizov — Minnesota
43.1 SACP and 10.2% ownership. Strong stack centerpiece, particularly alongside Boldy.
Interesting disagreement: McDavid owns the highest individual SACP at 47.8, but Edmonton carries only 2.5 implied goals against Tampa Bay’s 4.0. McDavid remains a viable elite individual play, but Kucherov and Necas have stronger Vegas support for their respective team offenses.
That is a meaningful reason to diversify away from simply locking the highest raw projection.
3. Best value plays
Value is projected fantasy points divided by salary in thousands. These are baseline values, not probabilities of achieving 5x or 6x.
| Player | Team | Value | Adj. own% | Implied goals |
|---|---|---|---|---|
| Jake Sanderson | OTT | 3.30x | 11.5% | 3.50 |
| Bobby McMann | SEA | 3.00x | 4.8% | 4.00 |
| Quinton Byfield | LAK | 2.77x | 5.8% | 2.75 |
| Zach Werenski | CBJ | 2.77x | 15.3% | 3.75 |
| Matt Knies | CBJ | 2.75x | 3.8% | 3.75 |
| Brandon Montour | SEA | 2.74x | 10.2% | 4.00 |
| Valeri Nichushkin | CBJ | 2.74x | 4.0% | 3.75 |
| Roman Kantserov | CHI | 2.72x | 4.5% | 2.25 |
Best Vegas-supported value: McMann. Seattle’s four implied goals and his 4.8% ownership make him especially attractive for tournaments.
Best pure value: Sanderson. His 3.30x baseline value and 34.3 SACP provide a strong combination of salary efficiency and ceiling.
Best alternative defensive value: Montour. Seattle’s four implied goals and his 35.3 SACP make him a compelling alternative to higher-owned defenders.
4. Top sleepers and leverage plays
Bobby McMann — SEA
Best value sleeper
SACP
32.1
Ownership
4.8%
Vegas goals
4.00
Seattle has one of the highest implied totals, while McMann remains under 5% adjusted ownership. Strong candidate for overweight GPP exposure.
Other notable sleepers:
| Player | SACP | Own% | Interpretation |
|---|---|---|---|
| Matt Knies | 28.4 | 3.8% | CBJ value with favorable Vegas support |
| Valeri Nichushkin | 29.4 | 4.0% | Low-owned ceiling in 3.75-goal environment |
| Quinton Byfield | 29.4 | 5.8% | Individual upside despite weaker Vegas support |
| Roman Kantserov | 31.5 | 4.5% | Contrarian ceiling; poor team environment |
| Dylan Holloway | 30.0 | 2.6% | Deep tournament differentiation |
| Kevin Fiala | 30.2 | 3.1% | Lower-owned individual upside |
The important distinction is that McMann, Knies, and Nichushkin have better team-scoring support than Byfield and Kantserov. The latter two require more favorable individual game scripts to outperform.
5. Best stack constructions
Using the uploaded line and power-play assignments, these are the combinations I would investigate first.
1
Minnesota — Kaprizov + Boldy + Quinn Hughes
All three are listed on the first even-strength line or first power-play unit in the uploaded data. Their SACP values total approximately 123.8, creating the strongest concentrated ceiling among these candidate combinations.
3.75 implied goals | High-ceiling correlated build
2
Tampa Bay — Kucherov + Guentzel + John Carlson
The uploaded file places Kucherov and Guentzel on line 1/PP1, with Carlson on PP1. Their combined SACP is approximately 107.2.
4.00 implied goals | Strong premium Vegas alignment
3
Ottawa — Stützle + Batherson + Sanderson
All three are listed on PP1. Combined SACP is approximately 110.2, with Sanderson providing salary efficiency.
3.50 implied goals | Strong power-play ceiling
4
Colorado — Necas + Lehkonen
Both are listed on even-strength line 1, although different power-play units. Their combined SACP is approximately 74.4 with low projected ownership.
4.00 implied goals | Premium leverage pairing
5
Carolina — Aho + Svechnikov + Ehlers
The uploaded assignments show Aho and Svechnikov on line 1/PP1, with Ehlers on PP1. Combined SACP is approximately 93.5.
4.00 implied goals | Alternative scoring environment
These combinations are based on the uploaded roster assignments, which should be verified against confirmed lineups before lock. They are not jointly simulated stack-win probabilities.
6. Goalie opportunities
| Goalie | SACP | Adj. own% | Team win probability |
|---|---|---|---|
| Jesper Wallstedt | 40.1 | 10.6% | 66.2% |
| Linus Ullmark | 39.1 | 10.1% | 61.6% |
| Ilya Sorokin | 34.9 | 9.9% | — |
| Logan Thompson | 33.6 | 6.8% | — |
Wallstedt is the leading projection-based goalie, with Ullmark close behind. Thompson offers an ownership discount, but his expected save volume and opponent scoring potential need verification before upgrading him.
For lineup construction, avoid pairing a goalie with a substantial opposing offensive stack unless intentionally building a rare game-script outcome.
7. Interesting advantages beyond the obvious
The Edmonton–Tampa Bay disagreement
Tampa Bay
4.00 implied goals
Kucherov: 45.1 SACP
Edmonton
2.50 implied goals
McDavid: 47.8 SACP
This is one of the slate’s most useful contrasts.
McDavid has the superior individual projection, but Tampa Bay has substantially stronger Vegas team-scoring expectations. That makes Kucherov a particularly attractive alternative to McDavid in tournaments, especially when adding Guentzel for correlation.
Ottawa’s ceiling exceeds what its implied total alone suggests
Ottawa ranks second in aggregate top-six SACP despite carrying only 3.5 implied goals.
That suggests its players may offer more fantasy-point upside than a Vegas-only ranking would indicate. Shot volume, assists, power-play production, and scoring concentration can all matter even when the team total is not the highest.
Seattle has unusual value concentration
Seattle combines four implied goals with several reasonably priced skaters. This can create more lineup flexibility than spending heavily on multiple premium stars.
McMann is the clearest salary-saving candidate, while Montour provides offensive-defense upside.
Low ownership is not automatically good leverage
Chicago has several low-owned skaters, but its 2.25 implied goals are among the slate’s weakest scoring forecasts.
Kantserov’s individual ceiling remains interesting, but he should not receive the same confidence as a comparably low-owned player from Colorado or Seattle.
8. Final Diamond Life exposure strategy
Qualitative exposure priorities, not optimized portfolio percentages.
| Category | Preferred targets |
|---|---|
| Premium anchors | Kucherov, Necas, Kaprizov |
| Raw-ceiling alternatives | McDavid, Draisaitl |
| Primary team stacks | MIN, COL, TBL |
| Secondary team stacks | OTT, SEA, CAR |
| Value plays | Sanderson, McMann, Montour |
| Deep sleepers | Knies, Nichushkin, Holloway |
| Goalie anchors | Wallstedt, Ullmark |
| Contrarian goalie | Thompson |
For single entry, my preferred starting construction is a verified Minnesota or Tampa Bay correlated core, complemented by value from Seattle or Ottawa. Colorado is an excellent alternative when prioritizing lower ownership.
For 3-Max, I would diversify across Minnesota, Tampa Bay, and Colorado rather than making three nearly identical premium-star builds.
For MME, I would investigate overweight exposure to Necas, McMann, and selected Seattle/Colorado combinations, while reserving smaller exposure for low-implied-total offenses.
9. Five strongest overall takeaways
Best premium Vegas + ceiling alignment: Kucherov
45.1 SACP, four implied goals, 10.4% adjusted ownership.
Best premium leverage: Necas
41.9 SACP, four implied goals, just 7.5% ownership.
Best concentrated team ceiling: Minnesota
Slate-leading 203.7 aggregate top-six SACP.
Best salary-saving Vegas opportunity: McMann
3.00x projected value with Seattle implied for four goals.
Best under-the-radar team environment: Ottawa
Second-highest aggregate top-six ceiling despite a 3.5-goal implied total.
Bottom line: The best Diamond Life NHL edge isn’t automatically McDavid’s highest raw ceiling or Tampa Bay’s four implied goals. It is the combination of strong scoring expectations, independently modeled right-tail upside, and ownership that leaves room for differentiation.
For this slate, Kucherov, Necas, Kaprizov, McMann, and Sanderson are the five players I would prioritize for further lineup construction and exposure analysis.
The 1.42 ownership adjustment and 80% cap are applied throughout. The simulated ceilings are model estimates, and the Vegas comparison uses the uploaded odds snapshot. Final entries should be checked for scratches, starting goalies, and confirmed lines.


Leave a Reply