
Diamond Life NHL DFS — Complete Slate Edge Report
November 12, 2026 | Vegas × Solver × Ownership × Right-Tail Upside
Executive summary
Our biggest takeaway is that Tampa Bay and Boston offer the strongest combinations of favorable scoring environments, player ceiling, and roster-building flexibility, while Minnesota provides the highest aggregate upside. Toronto, Chicago and Colorado offer more contrarian opportunities where the solver’s ceiling estimates are stronger than the market’s scoring outlook.
The best tournament approach is to prioritize players with paths to multi-point games, power-play production, and strong salary-adjusted P95/P99 outcomes—not simply those with the highest median projection.
Best raw ceiling
Pastrnak
43.3 SACP · 63.5 P99
Best Vegas alignment
Tampa Bay
4.0 implied goals
Best salary value
Lindholm
6.76 SACP per $1K
Best contrarian pivot
Nylander
50.2 P99 · 6.1% own.
1. Top ceiling plays
These are the skaters with the strongest modeled ability to separate from the field.
| Rank | Player | Salary | SACP | P99 | Own. |
|---|---|---|---|---|---|
| 1 | David Pastrnak | $7,900 | 43.3 | 63.5 | 11.0% |
| 2 | Nikita Kucherov | $8,200 | 38.8 | 56.3 | 10.1% |
| 3 | Kirill Kaprizov | $8,300 | 36.9 | 53.4 | 9.5% |
| 4 | Auston Matthews | $8,500 | 36.8 | 52.8 | 9.7% |
| 5 | Nathan MacKinnon | $9,200 | 36.1 | 52.8 | 9.6% |
| 6 | Matt Boldy | $8,000 | 35.8 | 52.7 | 8.7% |
| 7 | Jack Hughes | $8,700 | 34.7 | 50.8 | 11.7% |
| 8 | William Nylander | $6,700 | 33.8 | 50.2 | 6.1% |
The edge: Pastrnak is our strongest premium anchor. Kucherov is particularly attractive because Vegas independently supports Tampa’s scoring environment. Nylander provides one of the best discounts relative to his modeled upper-tail upside.
MacKinnon remains a high-ceiling play, but at $9,200 and only 2.75 implied team goals, he carries a greater opportunity cost than the similarly projected alternatives.
2. Best value plays and salary savers
| Player | Salary | SACP | SACP/$1K | Own. |
|---|---|---|---|---|
| Elias Lindholm | $3,800 | 25.7 | 6.76 | 5.7% |
| Anton Frondell | $3,900 | 24.7 | 6.32 | 5.0% |
| Roman Kantserov | $5,000 | 29.5 | 5.89 | 5.1% |
| Pavel Zacha | $4,900 | 28.2 | 5.76 | 7.5% |
| Gavin McKenna | $3,700 | 21.0 | 5.68 | 1.8% |
| J-J Peterka | $4,600 | 26.1 | 5.68 | 4.6% |
| Connor Bedard | $5,500 | 31.0 | 5.64 | 7.3% |
Lindholm is the standout salary saver, especially when paired with Boston’s favorable environment. Zacha offers an appealing balance of individual ceiling and potential Pastrnak correlation.
Bedard and Kantserov are more suited to tournament lineups that can tolerate Chicago’s weaker Vegas expectation.
3. Five sleepers and leverage plays
Calgary Flames v Toronto Maple Leafs
1. William Nylander — $6,700 | 6.1% ownership
The most appealing contrarian ceiling pivot. His 50.2 P99 is comparable to significantly more expensive stars. Best used when seeking differentiation without sacrificing premium upside.
Morning Chirps: Kantserov & Frondell score, more Panarin rumors
2. Roman Kantserov — $5,000 | 5.1% ownership
A 42.9 P99 gives him considerable upper-tail potential for a midrange salary. A tournament-oriented choice rather than a safe projection play.
Carolina Hurricanes v Chicago Blackhawks
3. Anton Frondell — $3,900 | 5.0% ownership
Strong salary-adjusted upside. Useful for unlocking expensive stacks while retaining some modeled ceiling.
McKenna, top prospect for 2026 NHL Draft, taking patient approach | NHL.com
4. Gavin McKenna — $3,700 | 1.8% ownership
A speculative deep-field tournament option. The low projected ownership creates leverage potential, but verify that he is active and has a meaningful role.
San Jose Sharks v Colorado Avalanche
5. Martin Necas — $6,600 | 5.1% ownership
A lower-owned way to access Colorado’s star-driven scoring ceiling without paying MacKinnon’s premium salary.
4. Best game environments
Implied goals are taken from the uploaded slate; top-three SACP represents aggregate individual upside, not simulated stack outcomes.
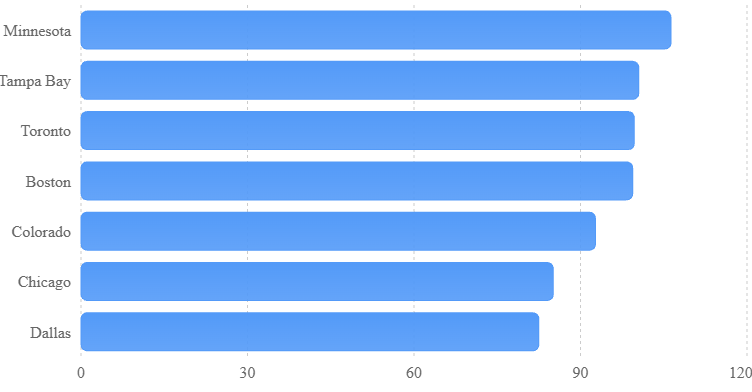
Aggregate modeled ceiling of the three leading skaters on each team.
How I would attack them
| Environment | Vegas goals | Tournament approach |
|---|---|---|
| Tampa Bay | 4.00 | Primary correlated stack |
| Boston | 3.75 | Single-entry anchor and value |
| Minnesota | 4.00 | Premium ceiling stack |
| Toronto | 2.50 | Selective contrarian stars |
| Colorado | 2.75 | Lower-owned star exposure |
| Chicago | 2.50 | Salary-saving upside |
| Dallas | 3.50 | Secondary stack candidate |
Tampa is the most attractive market-supported GPP environment. Boston provides the best blend of raw ceiling and salary flexibility. Minnesota offers the highest combined modeled ceiling, but requires more salary.
Toronto and Chicago are interesting precisely because the solver is more optimistic about certain players’ upper tails than their teams’ implied goal totals suggest. That disagreement creates tournament possibilities, not guaranteed mispricing.
5. Goaltender edge
| Goalie | Salary | SACP | Own. | Role |
|---|---|---|---|---|
| Ilya Sorokin | $7,600 | 28.5 | 9.0% | Raw ceiling |
| Logan Thompson | $7,200 | 26.8 | 8.2% | Salary efficiency |
| Connor Hellebuyck | $8,200 | 25.7 | 6.7% | Premium alternative |
| Jesper Wallstedt | $8,300 | 25.3 | 6.6% | Tournament pivot |
| Linus Ullmark | $7,500 | 25.3 | 6.7% | Midrange option |
Thompson is my preferred salary-adjusted goalie candidate, while Sorokin leads the modeled raw ceiling ranking. Confirm starters and matchups before finalizing either.
6. Interesting strategic advantages
The most important opportunity-cost comparisons are:
- Nylander versus Matthews: Nylander costs $1,800 less, carries 3.6 percentage points less projected ownership, and has a P99 only 2.6 points lower. This is one of the clearest salary-and-leverage pivots.
- Kucherov versus MacKinnon: Kucherov saves $1,000 and has a higher modeled SACP, while his team has a much stronger implied scoring environment in the uploaded data.
- Tampa versus Minnesota: Minnesota has 5.8 more top-three SACP points, but Tampa saves $800 and has four percentage points less summed player ownership.
- Boston value correlation: Zacha and Lindholm offer cheaper exposure to a 3.75-goal team environment, potentially reducing the opportunity cost of rostering Pastrnak.
- Chicago as a secondary stack: Bedard, Kantserov and Frondell provide modeled upside without forcing an expensive three-player construction. Their weaker Vegas support makes them a higher-variance choice.
7. Final Diamond Life tournament blueprint
Single-entry core
Priority
Pastrnak + Zacha is an appealing correlated starting point. Add a salary-efficient goalie and consider Nylander as a differentiated ceiling piece if the remaining roster construction permits.
3-Max strategy
Diversify primary team exposure among Tampa Bay, Boston and Minnesota. Avoid simply repeating the same premium forwards across all three builds.
Large-field MME
Use Toronto, Chicago and Colorado as selective contrarian branches. Prioritize actual line and power-play correlation over combining players solely because they share a team.
Final top-10 priority board
This ranking combines the different ways a player can help a tournament lineup, rather than sorting solely by raw SACP.
| Rank | Player | Primary edge |
|---|---|---|
| 1 | David Pastrnak | Highest individual ceiling |
| 2 | Nikita Kucherov | Vegas + solver agreement |
| 3 | William Nylander | Salary-adjusted leverage |
| 4 | Pavel Zacha | Boston scoring correlation |
| 5 | Kirill Kaprizov | Elite team ceiling |
| 6 | Elias Lindholm | Best salary efficiency |
| 7 | Matt Boldy | Minnesota stack upside |
| 8 | Connor Bedard | Midrange right-tail upside |
| 9 | Roman Kantserov | Low-owned tournament upside |
| 10 | Anton Frondell | Salary relief with ceiling |
Bottom line for readers
The best NHL DFS edge is not simply finding the highest-scoring game. It is finding concentrated fantasy upside in favorable scoring environments, then exploiting the salary and ownership differences between comparable players.
For this slate, the preliminary priorities are Tampa Bay and Boston for market-supported upside, Minnesota for premium ceiling, and Nylander-led Toronto or value-driven Chicago exposure for contrarian tournament construction.
All figures reflect the earlier projection-based solver run, not independently verified live odds or a fully correlated Monte Carlo simulation. The strongest next step before lock is validating current starting lineups, power-play roles, goalie confirmations and market movement. Those checks can materially change which edges are actionable.


Leave a Reply