
Diamond Life NHL DFS — Complete Slate Edge Summary
November 10, 2026 | Vegas + Monte Carlo + SACP + Ownership Leverage
The biggest takeaway from our NHL analysis is that Minnesota offers the strongest combination of ceiling and ownership leverage, Colorado provides the highest raw ceiling, and Ottawa and Los Angeles offer attractive ways to attack Vegas-supported scoring without following the most popular builds.
Montreal is our most interesting contrarian offense because the solver sees substantially more upside than its modest Vegas goal projection suggests.
1. Top five slate advantages
St Louis Blues v Minnesota Wild – Game One
Best overall edge
Kirill Kaprizov over Nathan MacKinnon
Kaprizov: 55.7 SACP, 12.0% ownership, $8,100.
MacKinnon: 56.6 SACP, 26.3% ownership, $8,200.
Nearly identical modeled ceilings, but Kaprizov is projected to be less than half as popular. This is our clearest individual tournament leverage opportunity.
Olympian Matt Boldy has 4 points in Wild’s 5-2 win over Avs
Matthew Boldy — Elite ceiling per ownership
$7,100 | 50.5 SACP | 10.0% ownership
Boldy offers a ceiling comparable to more expensive stars and correlates with Kaprizov in the uploaded line assignments. One of the strongest tournament building blocks.
Why we shouldn’t bet against Cole Caufield
Cole Caufield — Best contrarian ceiling winger
$6,600 | 42.3 SACP | 6.5% ownership
Montreal’s lower Vegas projection should suppress attention. Caufield has the modeled ceiling to outperform that expectation dramatically.
Even with recent struggles, Travis Green isn’t worried about Jake Sanderson
Jake Sanderson — Best defense value/leverage combination
$4,400 | 10.7% ownership | 5.60 separation score
Access to an Ottawa offense projected for 4.00 goals without spending heavily at defense. Especially useful in PP1-correlated constructions.
Los Angeles Kings 2024-25 Report Card: Grading Adrian Kempe’s season
Adrian Kempe — Underowned high-total exposure
$5,900 | 38.1 SACP | 7.1% ownership
Los Angeles carries a 3.75-goal projection. Kempe provides a lower-owned path to that scoring environment, particularly when paired with Panarin.
2. Best ceiling plays
| Rank | Player | Salary | SACP | Own. |
|---|---|---|---|---|
| 1 | Nathan MacKinnon | $8,200 | 56.6 | 26.3% |
| 2 | Kirill Kaprizov | $8,100 | 55.7 | 12.0% |
| 3 | Matthew Boldy | $7,100 | 50.5 | 10.0% |
| 4 | Quinn Hughes | $7,000 | 48.5 | 19.1% |
| 5 | Auston Matthews | $8,000 | 46.4 | 16.9% |
| 6 | Jack Hughes | $8,100 | 45.9 | 21.2% |
| 7 | Artemi Panarin | $7,300 | 43.5 | 8.6% |
| 8 | William Nylander | $7,600 | 43.3 | 6.9% |
Interpretation: MacKinnon remains the raw ceiling leader, but Kaprizov, Boldy, Panarin and Nylander are especially attractive when we account for ownership.
For single-entry, Kaprizov is my preferred expensive forward. For large-field MME, retain MacKinnon exposure while emphasizing less popular alternatives.
3. Best game environments
Vegas implied goals versus team ceiling
Vegas goals are from the uploaded slate; team SACP is the sum of eligible skater ceiling scores, not expected goals.
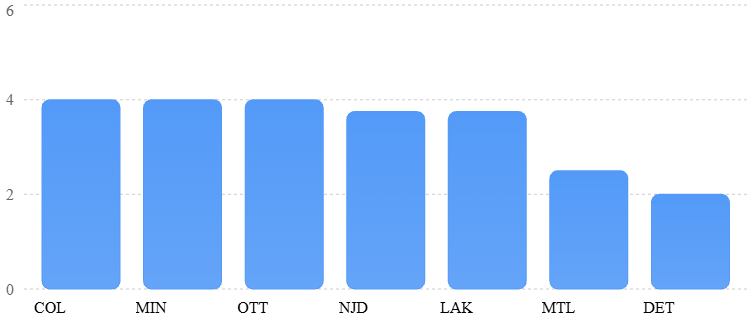
| Team | Team SACP | Tournament approach |
|---|---|---|
| Colorado | 403.7 | Highest raw ceiling |
| Minnesota | 397.8 | Best ceiling/ownership balance |
| Montreal | 354.4 | Contrarian upside |
| Ottawa | 310.4 | Vegas-supported leverage |
| Los Angeles | 305.0 | Underowned correlated offense |
| Detroit | 306.4 | Deep contrarian exposure |
Colorado and Minnesota are the clear top-tier ceiling environments. Ottawa and Los Angeles become more attractive once we consider Vegas scoring expectations alongside ownership.
Montreal and Detroit are higher-risk plays because the market’s goal projections are less supportive.
4. Best value plays and salary savers
These are the players offering the most useful combination of salary efficiency, modeled upside and lineup flexibility.
| Player | Salary | SACP | Own. | Role |
|---|---|---|---|---|
| Jake Sanderson | $4,400 | 30.9 | 10.7% | Best defensive value |
| Darren Raddysh | $5,000 | 33.6 | 8.9% | Ceiling-oriented defense |
| Matt Knies | $4,300 | 25.4 | 2.7% | Low-owned winger |
| Valeri Nichushkin | $4,700 | 27.1 | 2.3% | Colorado leverage |
| Juraj Slafkovsky | $5,300 | 33.1 | 4.3% | Montreal stack value |
| Gabriel Vilardi | $4,700 | 27.2 | 3.1% | Contrarian midrange |
| Luke Evangelista | $4,900 | 28.6 | 3.8% | Low-owned tournament option |
| Vitali Pinchuk | $3,300 | 24.5 | 2.8% | High-risk punt |
Best value combination: Sanderson and Slafkovsky provide access to useful offensive correlation while preserving salary for an elite forward.
Pinchuk grades extremely well in the model, but his NHL eligibility and role require independent confirmation. Do not treat him as a playable punt until verified.
5. Best sleepers and ownership pivots
Ranked by Tail Leverage from the solver. Higher values indicate greater modeled upside relative to projected ownership.
| Player | Salary | Ownership | Tail Leverage |
|---|---|---|---|
| Alex Tuch | $6,700 | 4.0% | 4.05 |
| Valeri Nichushkin | $4,700 | 2.3% | 4.04 |
| Alex DeBrincat | $6,800 | 5.6% | 3.82 |
| Cole Caufield | $6,600 | 6.5% | 3.81 |
| Viktor Arvidsson | $6,000 | 4.6% | 3.80 |
| Juraj Slafkovsky | $5,300 | 4.3% | 3.78 |
| Filip Forsberg | $6,500 | 5.9% | 3.75 |
| William Nylander | $7,600 | 6.9% | 3.74 |
Three sleepers deserve particular attention.
Nichushkin: His 2.3% ownership creates a different way to benefit from Colorado’s elite offensive environment without matching MacKinnon-heavy builds.
DeBrincat: Detroit’s market scoring projection is weak, but his individual tail leverage is strong. This is a classic high-risk, high-reward GPP play.
Forsberg: Offers meaningful individual ceiling without the ownership attached to the most obvious elite offenses.
6. Best correlated stacks
Minnesota — Kaprizov + Boldy + Quinn Hughes
Primary
Best combination of raw ceiling and ownership-adjusted upside. Confirm the listed PP1 correlation.
Colorado — MacKinnon + Necas + Lehkonen
Highest aggregate team ceiling. Strong for tournaments, but consider lighter MacKinnon exposure when ownership becomes excessive.
Ottawa — Stützle + Batherson + Sanderson
Particularly attractive PP1 combination with a 4.00-goal team projection and manageable individual ownership.
Los Angeles — Panarin + Kempe
Two-player offensive correlation with lower ownership and a favorable 3.75-goal projection.
Montreal — Suzuki + Caufield + Slafkovsky
Best contrarian full-stack concept. The solver sees substantial ceiling despite Vegas forecasting only 2.50 team goals.
7. Most important strategic advantages
The analysis reveals several edges that are more useful than simply ranking players by projected fantasy points.
- Ownership compression: MacKinnon’s popularity makes Kaprizov and Boldy more attractive relative to their ceilings.
- Power-play correlation: Ottawa provides a way to stack scoring events through multiple roster positions without necessarily paying elite salaries.
- Salary redistribution: Sanderson, Raddysh and midrange wingers can free salary for elite offensive exposure without sacrificing as much modeled ceiling.
- Contrarian environment selection: Montreal and Detroit offer opportunities when the solver’s upper-tail projections differ sharply from market expectations.
- Secondary exposure to elite offenses: Necas and Nichushkin can provide Colorado scoring exposure without depending entirely on MacKinnon.
- Lineup uniqueness: Combining a strong Minnesota core with lower-owned Ottawa or Los Angeles players may produce more differentiated lineups than stacking only the highest-projected stars.
8. Final condensed tournament player pool
ELITE CEILING ANCHORS
Kaprizov · MacKinnon · Boldy · Quinn Hughes · Matthews
BEST MIDRANGE CEILING
Caufield · Kempe · Slafkovsky · Sanderson · Raddysh
LOW-OWNED SEPARATORS
Nichushkin · DeBrincat · Forsberg · Nylander · Tuch
SALARY-SAVING OPTIONS
Knies · Evangelista · Vilardi · Hartman
Final Diamond Life verdict
My preferred approach is to build around Minnesota’s elite ceiling, incorporate selective exposure to Ottawa and Los Angeles, and use Montreal as the main contrarian stack.
For single-entry, I favor Kaprizov and Boldy as the offensive foundation, with Sanderson or Raddysh providing defensive salary flexibility. For MME, I would add more Caufield, Nichushkin, Nylander and DeBrincat to increase the chances of separating from the field.
The strongest overall tournament advantage is finding similar ceiling outcomes at substantially lower ownership, rather than simply paying for the highest raw projection.
All rankings are based on the uploaded projections, ownership estimates and modeled distributions. The game totals are from the uploaded slate rather than a live odds refresh, and current roster assignments, line combinations and starting goalies must be verified before entries lock.


Leave a Reply