
Diamond Life CBB — Vegas × Dual-Source Solver Edge Analysis
The biggest advantage from combining Vegas with our CBB solver is identifying where the betting market supports a high-scoring environment, our player projections independently identify concentrated fantasy production, and DFS ownership may not fully reflect that opportunity.
On this six-game slate, that changes our priorities considerably.
Rather than automatically making Arkansas–Virginia our dominant game stack because of its 162-point total, I would separate the slate into three opportunity types:
- Ceiling confirmation: Arkansas–Virginia and Pittsburgh–Penn State.
- Salary-adjusted market inefficiency: Nevada–Saint Mary’s.
- Conditional leverage and value: Boise State–Butler and USC–Wichita State.
The important distinction is that we have uploaded player projections and game totals, but not verified ownership percentages or independently calculated Monte Carlo ceiling distributions. Therefore, the leverage opportunities below are candidates, not confirmed ownership edges.
1. Vegas environments versus solver projections
| Game | Vegas total | Solver signal | Priority |
|---|---|---|---|
| Arkansas–Virginia | 162.0 | Wilkinson, De Ridder, Mallory | High-ceiling stack |
| Pittsburgh–Penn State | 154.5 | Ndongo, Juric, George | Premium concentration |
| Nevada–Saint Mary’s | 146.0 | Phipps, Price, Dent | Salary-adjusted priority |
| Boise State–Butler | 156.0 | Jackson, Wheeler-Thomas | Secondary leverage |
| USC–Wichita State | 156.5 | Extreme cheap-player projections | Verify before attacking |
| California–Houston | 145.5 | Dedan Thomas | Selective exposure |
The major change: Nevada–Saint Mary’s moves up our tournament priority list despite having a total 16 points below Arkansas–Virginia.
That is precisely the type of disagreement between the market’s game-level forecast and the solver’s player-level projections that we want to investigate.
2. The four strongest dual-source opportunities
Priority 1
Pittsburgh–Penn State
154.5 O/U
Best concentrated premium production
Ndongo projects for 39.64 FPTS, Juric 34.63, and George 31.37. Three strong individual projections across both sides support a concentrated fantasy environment.
Attack: Ndongo + Juric; George as a Pittsburgh alternative.
Priority 2
Nevada–Saint Mary’s
146.0 O/U
Best potential salary inefficiency
Phipps (34.02), Price (33.72), Bandelj (28.62), and Dent (31.02) have outstanding projections relative to their salaries.
Attack: Phipps or Price as a core midrange value; Dent as a potential opposing correlation play.
Priority 3
Arkansas–Virginia
162.0 O/U
Best market-confirmed scoring ceiling
Wilkinson (36.76), De Ridder (36.67), and Mallory (29.84) provide several credible routes into the slate’s highest-total game.
Attack: Wilkinson + De Ridder for ceiling; Mallory as an alternative.
Priority 4
Boise State–Butler
156.0 O/U
Secondary tournament opportunity
Jackson (30.38), Ellerbee (24.7), and Wheeler-Thomas (22.95 at $3,000) provide interesting roster combinations.
Attack: Jackson as a ceiling option, Wheeler-Thomas as conditional salary relief.
3. Where the market and player projections disagree
Best projected FPTS per $1,000 of salary
Selected players from the uploaded slate. Higher is better for salary efficiency; this is not an ownership-adjusted leverage score.
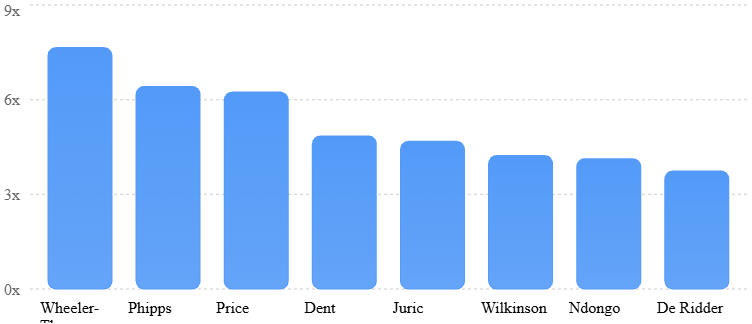
The chart illustrates why raw game totals should not dictate player selection. Nevada’s Phipps and Price project far better per dollar than most of the expensive players in higher-total games.
There is a useful distinction, however: Vegas and our solver are measuring different things. Vegas forecasts combined scoring, while the player projections estimate fantasy production based on usage, minutes, and statistical contributions. A lower-total game can still generate excellent fantasy value through concentrated usage, rebounds, assists, and defensive statistics.
The Nevada opportunity is therefore not necessarily a contradiction of Vegas. It is potentially a pricing inefficiency.
4. Where ownership could be lagging
Because RST% is missing, I would treat these as ownership hypotheses to validate rather than declare them low-owned.
| Player | Potential ownership dynamic | Tournament implication |
|---|---|---|
| Ivan Juric | May receive less attention than the expensive stars | Strong salary-adjusted premium alternative |
| Joshua Dent | Lower-total game could reduce attention | Useful secondary ceiling candidate |
| Chance Mallory | Could be overshadowed by Wilkinson and De Ridder | Alternative exposure to highest-total game |
| Jordan Ellerbee | Jackson may attract more Butler attention | Secondary Butler tournament option |
| Michael Cooper | California–Houston may be overlooked | Selective contrarian candidate |
The critical test is whether projected ownership is lower than each player’s probability of producing a tournament-relevant ceiling. Without ownership and simulated ceiling probabilities, we cannot quantify that gap.
5. How I would change single-entry and 3-Max construction
The strongest strategy is to separate game exposure from player selection. We want access to the right environments, but we do not need to force full game stacks when individual player ceilings and salaries offer better opportunities elsewhere.
| Construction decision | Adjustment |
|---|---|
| Premium anchor | Prioritize Ndongo or Wilkinson |
| Best upper-midrange pivot | Juric over more expensive alternatives |
| Midrange core | Phipps and Price, subject to minutes validation |
| Highest-total exposure | Wilkinson, De Ridder, or Mallory |
| Secondary game exposure | Jackson or Ellerbee |
| Contrarian salary relief | Wheeler-Thomas or Frison, after confirming roles |
| Potential fades | Overpriced premium players and unverified USC chalk |
Three tournament builds worth testing
Build A — Vegas-confirmed ceiling: Wilkinson + De Ridder, supported by value plays elsewhere. This construction captures the highest-total game without needing to force additional Arkansas–Virginia players.
Build B — Concentrated production: Ndongo + Juric, with Phipps or Price providing salary efficiency. This is my preferred starting hypothesis for single-entry because it balances high-end projection with roster flexibility.
Build C — Lower-total differentiation: Phipps + Price, with Dent as a potential bring-back, then a premium anchor from another game. This construction becomes especially attractive if ownership concentrates heavily on the highest-total games.
For 3-Max, I would test all three rather than duplicate the same premium core across every lineup.
6. The chalk-failure scenarios that matter
The Field Tendencies Exploit Engine should focus on three conditional outcomes:
- Arkansas–Virginia disappoints: Expensive players in the highest-total game fail to separate, while Ndongo and Juric deliver comparable or greater production at different salary combinations.
- Nevada exceeds individual fantasy expectations: Phipps and Price deliver 30+ FPTS at midrange salaries, allowing lineups to outperform more expensive builds.
- USC value projections fail: The unusually cheap USC players do not receive the playing time implied by their projections, creating an advantage for lineups built around more reliable alternatives.
The third scenario is particularly important. The uploaded file has conflicting minutes fields, so USC should remain a conditional situation until those inputs are reconciled.
Final Diamond Life priority board
VEGAS × SOLVER — PROVISIONAL TOURNAMENT PRIORITIES
1. Pittsburgh–Penn State
94
Best concentrated premium production
2. Nevada–Saint Mary’s
92
Best salary-adjusted opportunity
3. Arkansas–Virginia
90
Strongest scoring environment
4. Boise State–Butler
79
Secondary tournament options
5. California–Houston
68
Selective individual exposure
6. USC–Wichita State
55
High uncertainty; verify projections
Illustrative 0–100 prioritization scores, not calculated XVO, ownership leverage, or Monte Carlo outputs.
My strongest strategic conclusion: Pittsburgh–Penn State offers the clearest combination of market-supported scoring and concentrated premium projections. Nevada–Saint Mary’s offers the most intriguing salary-adjusted alternative. Arkansas–Virginia remains a major ceiling environment, but its higher total alone does not justify forcing exposure.
The potential tournament-winning edge is to combine the concentrated ceiling from Pittsburgh–Penn State or Arkansas–Virginia with the midrange efficiency from Nevada, while remaining willing to pivot away from fragile value plays.
The missing piece is verified ownership. Once RST% and validated minutes are available, we can distinguish genuinely under-owned ceiling from plays that simply look attractive on raw projections.


Leave a Reply