Diamond Life NHL DFS — Complete Slate Edge Report
November 5, 2026 | SACP • XVO v3.1 • Tail Leverage • Game Environments • Tournament Strategy
The biggest takeaway from our NHL Diamond Life Solver is that Edmonton offers the highest raw ceiling, but Utah and Detroit present some of the most interesting tournament opportunities when we account for salary, ownership, and correlated upside.
The goal isn’t simply to roster the highest-projected players. We want to identify where ceiling, ownership, and salary efficiency intersect to create opportunities for tournament separation.
1. Best ceiling plays — Who can break the slate?
| Rank | Player | Salary | SACP | Own. |
|---|---|---|---|---|
| 1 | Connor McDavid | $9,500 | 43.6 | 14.9% |
| 2 | Leon Draisaitl | $8,500 | 37.4 | 10.4% |
| 3 | Evan Bouchard | $7,500 | 34.9 | 11.7% |
| 4 | Nathan MacKinnon | $9,300 | 33.7 | 11.4% |
| 5 | Nikita Kucherov | $8,400 | 31.8 | 8.6% |
| 6 | Kyle Connor | $7,300 | 30.9 | 8.5% |
| 7 | David Pastrnak | $8,000 | 30.7 | 8.0% |
| 8 | Alex DeBrincat | $7,500 | 30.6 | 5.9% |
| 9 | Dylan Guenther | $6,600 | 30.5 | 5.7% |
| 10 | Cutter Gauthier | $8,100 | 30.2 | 7.4% |
Ceiling comparison
SACP fantasy points
McDavid
43.6
Draisaitl
37.4
Bouchard
34.9
MacKinnon
33.7
Kucherov
31.8
What the ceiling data tells us
McDavid is the clear nuclear anchor. His 43.6 SACP is nearly 30% higher than MacKinnon’s 33.7. At 14.9% projected ownership, his ceiling is not accompanied by overwhelming projected popularity.
Bouchard is a potential slate separator at defense. His 34.9 SACP is third overall, creating an unusual opportunity to obtain elite offensive ceiling from a defense slot.
DeBrincat and Guenther are the alternative-ceiling targets. Both project above 30 SACP with ownership below 6%. They deserve particular attention when constructing lineups without Edmonton’s expensive stars.
2. Best value plays — Salary-adjusted upside
These are the most interesting combinations of XVO and ceiling.
| Player | Salary | SACP | XVO |
|---|---|---|---|
| Trevor Connelly | $4,300 | 26.6 | 93.3 |
| Dylan Guenther | $6,600 | 30.5 | 91.4 |
| Moritz Seider | $5,500 | 25.2 | 90.0 |
| Logan Cooley | $5,100 | 23.9 | 90.0 |
| Clayton Keller | $6,500 | 28.9 | 89.8 |
| Roman Kantserov | $4,900 | 22.5 | 89.5 |
| Mark Scheifele | $6,200 | 27.8 | 89.4 |
| Mikhail Sergachev | $5,800 | 26.3 | 89.3 |
The strongest salary-adjusted opportunities are:
- Connelly: The highest XVO in the entire slate, with a 26.6 SACP at $4,300.
- Cooley: A strong midrange way to access Utah’s offensive ceiling.
- Seider: Offers defenseman ceiling without paying Bouchard’s premium.
- Scheifele: An appealing alternative to the most expensive centers.
- Guenther: Arguably the best combination of substantial absolute ceiling, manageable salary, and ownership opportunity.
The key distinction: a player with high XVO is not necessarily more likely to score the most fantasy points. XVO measures a combination of upside and roster-construction opportunity.
3. Sleepers — Finding underowned right-tail outcomes
| Player | Salary | SACP | Own. | Role in builds |
|---|---|---|---|---|
| Trevor Connelly | $4,300 | 26.6 | 4.4% | Midrange separator |
| Vitali Pinchuk | $2,500 | 18.3 | 1.5% | Deep punt |
| William Wallinder | $3,000 | 18.0 | 1.7% | Salary-saving defense |
| Justin Brazeau | $2,600 | 16.2 | 1.2% | Contrarian punt |
| Adam Jiricek | $3,000 | 16.3 | 1.9% | Defense punt |
| Anthony Duclair | $2,700 | 13.7 | 0.8% | Low-owned dart |
Connelly is the clear preferred sleeper on the model numbers. His ceiling is substantially higher than the minimum-salary options.
The others are more appropriate for large-field MME than single-entry. Their modeled right tails are interesting, but cheap players carry substantial ice-time and role risk. These recommendations remain conditional on confirming that each player is active, correctly assigned to the slate, and expected to receive meaningful minutes.
4. Best game environments — Where to concentrate exposure
Offensive ceiling by team
Combined SACP of each team’s top six skaters
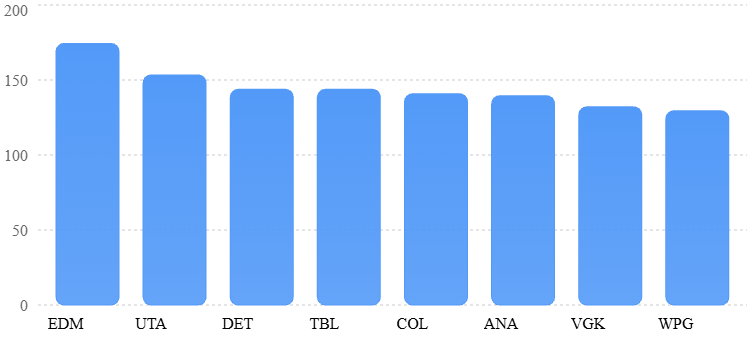
| Team | Top-six SACP | Tournament advantage |
|---|---|---|
| Edmonton | 174.4 | Highest concentrated ceiling |
| Utah | 153.4 | Best alternative stack candidate |
| Detroit | 143.8 | Low-owned offensive upside |
| Tampa Bay | 143.8 | Kucherov-led ceiling |
| Colorado | 140.8 | Elite premium pivot |
| Anaheim | 139.5 | Alternative offensive concentration |
| Vegas | 132.1 | Midrange salary relief |
| Winnipeg | 129.5 | Connor–Scheifele correlation |
My preferred game-environment angles
EDM–ANA: Premium ceiling environment
Edmonton is the strongest offensive side in the model. McDavid, Draisaitl, and Bouchard combine for 115.9 SACP, which creates a powerful correlated ceiling opportunity.
However, rostering all three costs $25,500. That is a substantial investment, so a two-player Edmonton core may offer better flexibility.
UTA: Best alternative offensive stack
Guenther, Keller, and Sergachev combine for 85.7 SACP. Add Cooley and the four-player group reaches 109.6.
Utah’s attraction is the combination of concentrated ceiling and strong individual XVO scores. The key is confirming shared even-strength or power-play time rather than assuming all four players correlate equally.
DET–VGK: Contrarian game environment
Detroit’s top-six SACP is 143.8, while Vegas contributes another 132.1. Both sides show attractive offensive concentration.
This is a useful environment for selective game stacking, particularly when targeting DeBrincat, Seider, or Connelly.
TBL–CHI: Kucherov-centered upside
Tampa Bay offers 143.8 top-six SACP. Kucherov leads the attack with 31.8 SACP at 8.6% ownership.
That makes Tampa an attractive pivot when expensive Edmonton constructions become difficult to balance.
5. Goalie edges — Where the solver sees value
The workbook’s goalie projections identify several interesting options.
| Goalie | Salary | Proj. FPTS | Own. |
|---|---|---|---|
| Joel Hofer | $7,300 | 14.79 | 9.2% |
| Ilya Sorokin | $7,200 | 14.40 | 7.9% |
| Juuse Saros | $7,100 | 13.41 | 8.4% |
| Andrei Vasilevskiy | $8,500 | 13.06 | 5.5% |
| Jake Oettinger | $7,900 | 12.44 | 4.7% |
Hofer and Sorokin stand out on projected points per dollar. They offer the highest two goalie projections in this group at relatively affordable salaries.
Vasilevskiy is a tournament alternative at just 5.5% projected ownership, although his higher salary requires a stronger outcome to justify the investment.
Goalie analysis has a major limitation here: the statistical simulation is not a complete save-volume, win-probability, and shutout model. These are preliminary rankings, and starting assignments must be confirmed.
6. Ownership leverage — Where the field may be vulnerable
The most useful leverage opportunities fall into three categories.
Premium ceiling at modest ownership
DeBrincat (5.9%), Guenther (5.7%), and Kucherov (8.6%) provide meaningful raw ceilings without requiring especially high projected ownership.
Correlated team leverage
Utah and Detroit offer opportunities to benefit from multiple players succeeding together. That can be more valuable in tournaments than rostering unrelated low-owned one-offs.
Salary-adjusted right-tail access
Connelly, Pinchuk, Wallinder, and Brazeau rank prominently in the Right-Tail MME analysis. Their main advantage is freeing salary for high-ceiling anchors while retaining modeled upside.
One important distinction: low ownership by itself does not create leverage. The player still needs enough ceiling relative to salary, roster opportunity cost, and the probability of reaching that ceiling.
7. Interesting strategic advantages
Advantage A — Bouchard versus expensive forwards
Bouchard’s 34.9 SACP exceeds MacKinnon’s 33.7 despite costing $1,800 less.
That doesn’t automatically make Bouchard the better play because positional replacement values differ. But it suggests that allocating significant salary to defense could be a competitive strategy rather than treating defense as a position to punt.
Advantage B — Utah’s balanced ceiling construction
A Utah core of Guenther, Keller, and Sergachev costs $18,900 and carries 85.7 combined SACP.
That leaves more salary available than the McDavid–Draisaitl–Bouchard trio while maintaining access to multiple correlated scoring outcomes.
Advantage C — Attack concentrated scoring
NHL tournaments are frequently decided by correlated goals and assists. Our model’s strongest offensive concentrations are Edmonton, Utah, Detroit, and Tampa Bay.
Rather than selecting one player from every team, the better tournament hypothesis is to target concentrated scoring events that benefit multiple roster spots.
Advantage D — Don’t overuse minimum-salary sleepers
The model identifies several cheap players with attractive salary-adjusted right tails, but their absolute ceilings are much lower than those of the top midrange plays.
A lineup with one carefully selected salary saver can be stronger than a lineup relying on three speculative punts simply to fit multiple superstars.
Advantage E — Differentiate through roster structure
You do not necessarily need to fade McDavid to build a differentiated lineup.
A McDavid roster using a lower-owned secondary stack, a different defenseman combination, or an unconventional goalie can offer meaningful differentiation without sacrificing the slate’s highest modeled individual ceiling.
8. My preferred tournament exposure priorities
These are qualitative priorities rather than optimized exposure percentages.
| Priority | Players or teams | Strategy |
|---|---|---|
| Tier 1 | McDavid, Bouchard | Elite raw ceiling |
| Tier 1 | Guenther, Keller, Cooley | Utah offensive concentration |
| Tier 2 | DeBrincat, Seider | Detroit leverage |
| Tier 2 | Kucherov, MacKinnon | Premium alternatives |
| Tier 2 | Connelly | Salary-adjusted separator |
| Tier 3 | Pinchuk, Wallinder, Brazeau | Speculative MME salary relief |
For single-entry, I would start with either McDavid plus a balanced secondary stack, or a Utah-centered build that can afford multiple high-ceiling players elsewhere.
For 3-Max, the three initial constructions I’d investigate are Edmonton-centered, Utah-centered, and Detroit/Tampa-centered.
For large-field MME, I would distribute exposure across these different offensive scenarios and use the Right-Tail MME rankings to identify lower-owned complementary pieces.
Final Diamond Life verdict
Best raw ceiling
Connor McDavid
43.6 SACP
Best XVO
Trevor Connelly
93.3
Best offensive ceiling
Edmonton
174.4
Best alternative stack
Utah
153.4
My five favorite tournament targets from the solver:
McDavid, Bouchard, Guenther, DeBrincat, and Connelly.
The central slate strategy: Preserve access to Edmonton’s massive ceiling while using Utah, Detroit, and selective midrange values to exploit ownership and salary inefficiencies.
These findings are based on the uploaded slate and the simplified statistical model, not verified live NHL lineups or independently confirmed Vegas markets. The source contains some unusual player/team assignments, so lineup status, team assignments, and correlations must be checked before lock.


Leave a Reply