Full Slate Edge Report — Ceiling, Value, Sleepers & Tournament Strategy
The biggest takeaway from our first CBB solver run is that the strongest DFS opportunities are not necessarily coming from the highest-priced players or highest-total games.
Our SACP ceiling projections reveal several midrange players with slate-breaking potential, inexpensive options with exceptional salary-adjusted upside, and game environments where individual opportunity could outweigh the Vegas scoring expectations.
For this slate, I would build around five principles:
- Prioritize ceiling efficiency: Target players with strong P95/P99 outcomes relative to salary rather than simply chasing raw projections.
- Exploit the midrange: Several $6,500–$8,200 players offer competitive or superior ceilings to the $9,700–$10,000 spend-ups.
- Attack concentrated production: Favor players capable of absorbing a large percentage of their team’s offense, even in games with modest totals.
- Respect blowout risk: Massive favorites offer scoring opportunities, but their starters may lose valuable fourth-quarter minutes.
- Separate verified values from projection anomalies: Some of the most attractive salary plays have missing or zero-minute data, making confirmation essential.
1. Best overall ceiling plays
| Rank | Player | Salary | SACP | Assessment |
|---|---|---|---|---|
| 1 | Andy Stefonowicz | $7,000 | 60.42 | Best overall ceiling anchor |
| 2 | Jordan Frison* | $3,800 | 54.33 | Enormous conditional upside |
| 3 | Thomas Dowd | $7,900 | 47.63 | Premium midrange ceiling |
| 4 | Jahari Long* | $6,600 | 46.44 | High-upside tournament option |
| 5 | Michael Cooper | $8,200 | 45.68 | Strong alternative anchor |
| 6 | Will Berg* | $6,500 | 45.57 | Conditional midrange upside |
| 7 | Tahaad Pettiford | $10,000 | 44.65 | Expensive, lower ceiling efficiency |
| 8 | Jalen Jackson | $9,700 | 43.13 | Premium-price opportunity cost |
*Source lists zero projected minutes. These rankings are conditional until roles are confirmed.
The Stefonowicz advantage
Stefonowicz is the standout tournament target because he combines three desirable characteristics: the slate’s highest modeled SACP, an accessible $7,000 salary, and a lower-total game environment that could discourage some field exposure.
His 60.42 SACP is approximately 35% higher than Pettiford’s 44.65 despite costing $3,000 less.
That creates a significant opportunity-cost edge: Stefonowicz provides greater modeled right-tail access while leaving more salary available for another high-upside player.
Dowd versus Cooper
Dowd offers 47.63 SACP for $7,900, compared with Cooper’s 45.68 at $8,200.
Both belong in the tournament pool. Dowd wins the raw ceiling-to-salary comparison, while Cooper provides exposure to a different offensive environment. Their game scripts and actual ownership should determine how aggressively to separate them.
3. Best value plays and salary savers
These are the players with the greatest potential to outperform their salary.
| Player | Salary | Proj | SACP | Ceiling/$1K |
|---|---|---|---|---|
| Jordan Frison* | $3,800 | 31.28 | 54.33 | 14.30 |
| Melvin Bell | $3,600 | 22.11 | 34.51 | 9.59 |
| Rob Diaz* | $4,500 | 22.43 | 39.35 | 8.74 |
| Caleb Smith* | $4,700 | 23.48 | 41.01 | 8.73 |
| Andy Stefonowicz | $7,000 | 36.66 | 60.42 | 8.63 |
| Mikah Ballew* | $3,700 | 17.18 | 29.82 | 8.06 |
Melvin Bell — my favorite verified salary saver
$3,600
33 projected minutes
22.11 projected FPTS
27.18% usage
34.51
SACP ceiling
9.59 SACP/$1K
7.16 Right-Tail MME
Bell is one of the most interesting discoveries in the entire slate. His 33 projected minutes and 27.18% usage suggest substantial offensive opportunity at a near-minimum salary.
He has an attractive combination of volume, playing-time security in the source projections, and salary relief.
Strategic edge: Bell allows you to pay for a high-ceiling anchor without sacrificing as much upside at the value position.
Jordan Frison — biggest conditional pricing anomaly
Frison’s $3,800 salary and 54.33 SACP create an extraordinary model value. However, his zero-minute record is a major uncertainty.
He should be placed on the verification list, not blindly locked into tournament builds.
If his minutes and role are confirmed, his ceiling-to-salary profile would justify aggressive consideration.
4. Sleepers and diamonds in the rough
These are the names I would investigate beyond the obvious high-projection options.
Rob Diaz — North Dakota State
$4,500 · 39.35 SACP · 29.13% usage
Strong potential secondary scoring option. His ceiling profile is attractive alongside Stefonowicz and Bell, although zero projected minutes require verification.
Conditional
Caleb Smith — CS-NR
$4,700 · 41.01 SACP
A potential underdog run-back in the slate’s highest-total game. Could benefit if CS-NR keeps the game competitive and its main contributors retain full minutes.
Conditional
Mikah Ballew — CS-NR
$3,700 · 29.82 SACP
An inexpensive alternative to the more obvious Wichita State side. Offers a possible salary-saving route to the 161-point game total.
Conditional
Jake Wilkins — California
$3,000 · 9 projected minutes · 26.94% usage
A very speculative punt. His limited minutes are the main obstacle, but a favorable rotation change could make him interesting in large-field tournaments.
High risk
Jordan Ellerbee — Butler
$7,800 · 25.63 projected FPTS · 29 minutes
A useful secondary ceiling candidate from Butler’s high-scoring environment, particularly for lineups seeking a different construction than Auburn or Wichita State.
Pivot
5. Game environments — where to attack
The game-environment analysis is particularly valuable because the highest team implied total and highest individual ceiling are not necessarily found in the same matchup.
Wichita State vs. CS-NR
Highest total
161.0
Wichita State -14.5 · Implied 87.75–73.25
Highest-total environment and the largest aggregate team SACP for Wichita State. Strong potential for multiple ceiling performances, but missing minutes for key candidates reduce confidence.
California vs. Radford
157.0
California -15.5 · Implied 86.25–70.75
Cooper provides an attractive way to capture California’s scoring upside. The 15.5-point spread creates moderate blowout concerns.
Butler vs. Fairleigh Dickinson
153.0
Butler -24.5 · Implied 88.75–64.25
Butler has the second-highest implied team score. Jackson and Ellerbee are relevant, but the spread makes this a volatile environment for starters’ minutes.
Auburn vs. Southeastern Louisiana
151.5
Auburn -26.5 · Implied 89.0–62.5
Auburn leads the slate in implied team scoring. Dowd offers strong ceiling efficiency, but the 26.5-point spread is the biggest risk to full starter minutes.
North Dakota State vs. Saint Mary’s
148.5
North Dakota State +13 · Implied 67.75–80.75
This is my favorite contrarian environment to investigate. Stefonowicz and Bell combine elite individual efficiency with a team total that may be overlooked.
Bars compare listed game totals relative to the slate-high 161.0, not win probabilities or proprietary game-environment scores.
6. Five advanced tournament edges
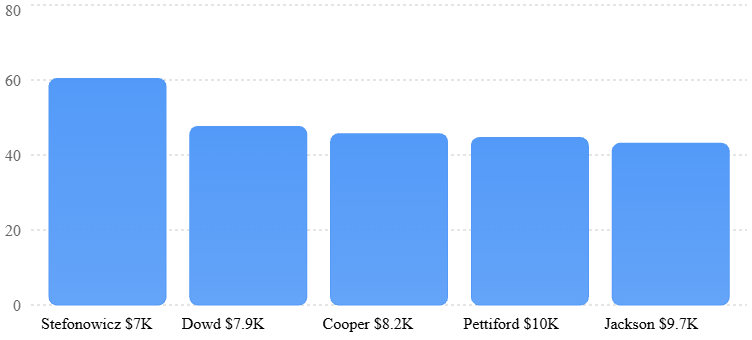
Edge 1 — The midrange is beating the spend-ups
SACP ceiling by salary
Modeled ceiling, in DraftKings fantasy points. Higher is better.
| Player | Sacp |
|---|---|
| Stefonowicz $7K | 60.42 |
| Dowd $7.9K | 47.63 |
| Cooper $8.2K | 45.68 |
| Pettiford $10K | 44.65 |
| Jackson $9.7K | 43.13 |
The opportunity cost of Pettiford and Jackson is meaningful. The model projects higher ceilings for Stefonowicz, Dowd, and Cooper at lower salaries.
That doesn’t make the expensive players automatic fades. It does mean their premium prices need to be justified by ownership, role stability, or information the current model may not capture.
Edge 2 — North Dakota State offers concentrated upside
North Dakota State has only eight players represented in the uploaded pool, with a 22.6 average SACP, versus 17.5 for Auburn and 15.2 for California.
This suggests a potentially concentrated distribution of fantasy production, although player-pool size is not proof of actual rotation depth.
Stefonowicz and Bell are the clearest ways to exploit this environment. Diaz becomes an additional candidate if his minutes are confirmed.
Edge 3 — Massive favorites create rotation leverage
Auburn (-26.5) and Butler (-24.5) have excellent implied scoring but meaningful blowout risk.
One tournament approach is to reduce reliance on multiple expensive starters from these teams and favor players whose scoring opportunity is more resilient to reduced fourth-quarter minutes.
A close-game script would benefit those expensive starters, so fading them entirely also carries risk.
Edge 4 — The best game stack may be a less obvious one
Wichita State–CS-NR has the highest total, but its player projections have substantial missing-minute uncertainty.
North Dakota State–Saint Mary’s offers a different route: strong individual ceiling projections despite a lower game total. That makes it an appealing contrarian construction, particularly if the field gravitates toward the 157–161-point environments.
Edge 5 — Ownership uncertainty is itself a decision factor
Because the uploaded slate lacks authoritative RST%, our Tail Leverage and XVO ownership components use proxies.
We should not interpret those proxy scores as verified low ownership. The better approach is to identify strong ceiling candidates now, then compare actual ownership projections once available.
7. Final Diamond Life player priorities
| Role | Primary target | Alternative |
|---|---|---|
| Best ceiling anchor | Andy Stefonowicz | Thomas Dowd |
| Midrange spend | Thomas Dowd | Michael Cooper |
| Best verified value | Melvin Bell | — |
| Premium spend-up | Tahaad Pettiford | Jalen Jackson |
| Secondary pivot | Jordan Ellerbee | Michael Cooper |
| Conditional sleeper | Rob Diaz | Caleb Smith |
| Conditional salary anomaly | Jordan Frison | Mikah Ballew |
8. Single-entry versus large-field MME
Single-entry / 3-Max
Prioritize Stefonowicz, Dowd, Cooper, and Bell.
Favor players with usable minutes projections and strong salary-adjusted ceilings. Limit exposure to zero-minute data anomalies until verified.
Large-field MME
Expand the pool to conditional plays such as Frison, Long, Berg, Diaz, and Smith once their roles are established.
Mix game environments and consider differentiated constructions that retain P95/P99 access.
Final verdict
My three biggest edges from this slate are:
- Stefonowicz’s ceiling-to-salary advantage. He is the strongest preliminary centerpiece for tournament builds.
- Melvin Bell’s inexpensive opportunity profile. His minutes and usage provide an unusually attractive value combination.
- The contrast between team scoring and individual ceiling. Auburn, Butler, and Wichita State offer strong offensive environments, but North Dakota State may provide more concentrated fantasy production at better salaries.
The biggest remaining uncertainty is data quality: 83 of the 116 players have zero minutes in the source field. That limits confidence in several attractive sleepers and team-level totals. The results should be treated as an initial modeled ranking, not a final exposure prescription.
My preferred initial core is Stefonowicz + Dowd + Bell, with Cooper as the next major ceiling candidate. I would keep Frison at the top of the verification list because confirming his projected role could materially change the slate.


Leave a Reply