November 3, 2026 | Player Pool #58 | Early-edge discovery
The first solver pass points toward a particularly interesting NHL tournament strategy: prioritize salary-efficient offensive correlations over automatically stacking the biggest superstars.
There are three important findings:
- Vegas Golden Knights, Carolina Hurricanes and Colorado Avalanche lead the slate in aggregate offensive SACP.
- Winnipeg, Philadelphia and Utah offer compelling alternative paths to tournament ceiling, with comparatively attractive projected ownership.
- Trevor Connelly, Gabriel Vilardi and Oliver Bonk stand out as unusually strong salary-adjusted opportunities in the uploaded projections.
These are preliminary model findings, not verified starting-lineup or betting-market recommendations. The workbook uses 20,000 approximate correlated simulations, and I found some player/team assignments that need verification before final lock.
1. Slate overview: Where the early edges are forming
TOP OFFENSIVE ENVIRONMENTS — AGGREGATE SACP
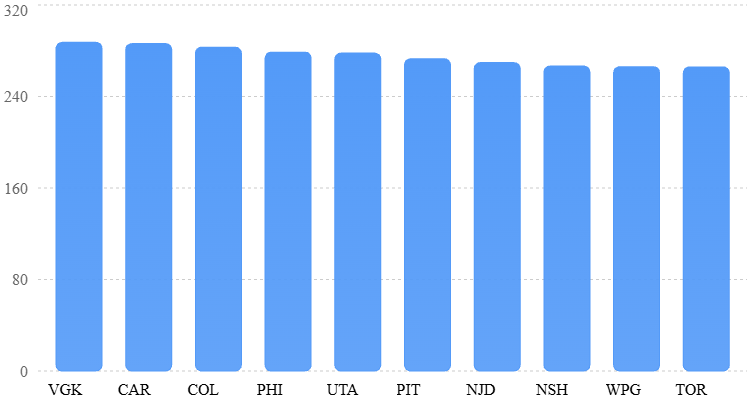
| Team | Sacp |
|---|---|
| VGK | 287.34 |
| CAR | 286.27 |
| COL | 283.12 |
| PHI | 278.79 |
| UTA | 277.93 |
| PIT | 272.96 |
| NJD | 269.64 |
| NSH | 266.6 |
| WPG | 266.11 |
| TOR | 265.89 |
Sum of modeled skater SACP, not a Vegas implied goal total. Team depth and roster size affect totals.
| Offense | Total SACP | Avg. SACP | Sum RST% |
|---|---|---|---|
| Vegas | 287.34 | 15.96 | 46.3% |
| Carolina | 286.27 | 15.90 | 44.3% |
| Colorado | 283.12 | 15.73 | 48.7% |
| Philadelphia | 278.79 | 15.49 | 26.1% |
| Utah | 277.93 | 16.35 | 46.2% |
| Pittsburgh | 272.96 | 16.06 | 31.0% |
| Winnipeg | 266.11 | 14.78 | 28.3% |
Sum RST% is the sum of individual player ownership projections, not the probability that a stack is rostered.
The early separator is Philadelphia. Its aggregate SACP sits close to the top three, but its combined individual ownership is substantially lower. Pittsburgh and Winnipeg also merit attention for that reason.
Utah actually has the highest average SACP per projected skater among these seven teams, making it worth examining through concentrated line and power-play combinations.
2. Top spend-up anchors
The strongest raw-ceiling plays are not necessarily the best tournament investments. We want high SACP, realistic salary construction and a path to beating ownership.
| Player | Salary | RST% | SACP | P99 |
|---|---|---|---|---|
| Connor McDavid | $9,800 | 11.0% | 33.39 | 44.42 |
| Nathan MacKinnon | $9,300 | 11.3% | 31.04 | 40.39 |
| Kyle Connor | $7,500 | 6.4% | 30.85 | 41.38 |
| Kirill Kaprizov | $8,500 | 7.5% | 29.41 | 38.90 |
| Cutter Gauthier | $7,600 | 7.7% | 29.35 | 39.05 |
| Nikita Kucherov | $8,200 | 7.8% | 29.05 | 38.02 |
| Matt Boldy | $8,000 | 6.9% | 29.01 | 38.63 |
| Zach Werenski | $7,100 | 7.1% | 28.54 | 37.66 |
| Leon Draisaitl | $8,800 | 6.6% | 28.42 | 37.42 |
| Mark Scheifele | $6,100 | 6.6% | 28.06 | 36.84 |
Winnipeg Jets v Toronto Maple Leafs
Kyle Connor — Preferred salary-adjusted anchor
30.85 SACP
Only 0.19 modeled SACP behind MacKinnon while costing $1,800 less. His 6.4% projected ownership also provides a favorable tournament comparison. Winnipeg’s correlated offensive pieces make him particularly appealing.
Connor McDavid — Raw ceiling king
33.39 SACP
Highest individual skater SACP. His ownership isn’t prohibitive, but the $9,800 salary creates significant opportunity cost. Best suited to constructions with credible cheap skaters rather than forcing several expensive anchors.
Kirill Kaprizov News, Biography, NHL Records, Stats & Facts
Kirill Kaprizov — Correlated ceiling anchor
29.41 SACP
His pairing with Matt Boldy, who carries 29.01 SACP, creates an appealing high-upside offensive combination. Both are strong individual plays in the model, although their shared outcome risk matters.
Early decision: Kyle Connor is my preferred anchor from a salary-efficiency perspective. McDavid leads in raw ceiling, while Kaprizov and Boldy offer a concentrated alternative.
3. Best value plays: The salary unlocks
These are the plays that can make expensive NHL combinations realistically buildable.
| Player | Salary | RST% | SACP | SACP/$1K |
|---|---|---|---|---|
| Trevor Connelly | $4,300 | 6.6% | 28.87 | 6.71 |
| Oliver Bonk | $4,300 | 3.4% | 23.60 | 5.49 |
| Gabriel Vilardi | $4,200 | 3.0% | 21.47 | 5.11 |
| Tristan Luneau | $4,200 | 4.2% | 21.37 | 5.09 |
| Ben Kindel | $4,400 | 3.0% | 20.66 | 4.70 |
| Neal Pionk | $4,500 | 3.6% | 20.24 | 4.50 |
| Owen Tippett | $4,300 | 1.8% | 20.15 | 4.69 |
| Tyson Foerster | $3,800 | 2.0% | 19.94 | 5.25 |
SACP/$1K is modeled SACP divided by salary in thousands; it is a ceiling-efficiency measure, not expected fantasy points per dollar.
The strongest value signal is Trevor Connelly, whose $4,300 salary and 28.87 SACP are unusually favorable. That magnitude of edge is also a reason to verify his projection, NHL role and power-play assignment rather than blindly locking him in.
Vilardi offers a cleaner correlation-based roster construction alongside Connor and Scheifele. Tippett and Foerster offer lower-owned alternatives in the Philadelphia offense.
4. Best offensive stack opportunities
For NHL, I want to distinguish an entire team’s scoring potential from the actual correlated players we can roster. The following combinations use the uploaded pool’s line and power-play information as preliminary guidance.
Winnipeg — Preferred concentrated stack
Connor + Scheifele + Vilardi
80.38 combined SACP
$17,800 salary
Their individual projections and prices provide an attractive combination of ceiling and salary flexibility. Their uploaded RST% values are 6.4%, 6.6% and 3.0%.
Why Team USA can win at the Milan Cortina Olympics, according to Clayton Keller
Utah — Strong secondary stack
Guenther + Keller + Sergachev
78.10 combined SACP
The uploaded pool places these players in its top correlation grouping. Utah’s high average offensive SACP makes this one of the more appealing environments to investigate for power-play stacking.
Travis Konecny scores twice to lift the Flyers over the Sabres 5-2 | FOX 29 Philadelphia
Philadelphia — Ownership-discount opportunity
Zegras + Konecny + Sanheim, or a verified Michkov-centered combination
278.79 team SACP
The team’s strong aggregate model output against a low combined RST% is noteworthy. I’d prioritize identifying the actual shared even-strength and power-play roles before choosing the final three-player structure.
Minnesota Wild v Colorado Avalanche
Colorado — Premium ceiling stack
MacKinnon + Necas + Makar
79.86 combined SACP
This construction captures an elite individual ceiling and a defenseman with strong offensive involvement. The downside is substantial salary commitment, requiring value elsewhere.
One modeling caution: the uploaded LINE field groups defensemen with forwards. I therefore treat these as candidate correlation groups, not proof that all listed players skate together at even strength. The summed SACP numbers are descriptive, not simulated stack-level P95 outcomes.
5. Goalie analysis: Anchors versus leverage
Goalie selection is one of the most consequential decisions on an NHL DFS slate. We want the right combination of save volume, win probability, shutout potential and salary.
| Goalie | Salary | RST% | SACP | P99 |
|---|---|---|---|---|
| Connor Hellebuyck | $8,000 | 6.5% | 31.72 | 42.77 |
| Jesper Wallstedt | $8,300 | 6.2% | 31.39 | 42.96 |
| Andrei Vasilevskiy | $8,500 | 5.7% | 31.13 | 42.70 |
| Jet Greaves | $7,400 | 6.8% | 30.83 | 41.86 |
| Juuse Saros | $7,000 | 6.9% | 29.51 | 40.46 |
| Scott Wedgewood | $8,000 | 5.0% | 29.43 | 39.84 |
| Joseph Woll | $7,100 | 5.3% | 28.52 | 39.39 |
My early goalie priorities
Jet Greaves has one of the most attractive salary-to-SACP relationships in the pool: $7,400 for 30.83 SACP. The risk is his listed matchup against Colorado, which could generate saves but also considerable goal-against exposure.
Juuse Saros provides a $7,000 salary alternative with 29.51 SACP, leaving more flexibility for expensive skaters. His listed Carolina matchup makes confirmation of game conditions important.
Vasilevskiy offers a higher-cost alternative with 31.13 SACP and a projected ownership of 5.7%.
There is an important data-quality issue here: the uploaded pool assigns Connor Hellebuyck to New Jersey and Joseph Woll to Philadelphia. Those assignments require verification. I would not use either goalie’s modeled matchup or team correlation as actionable until the source data is reconciled.
6. Right-tail sleepers and tournament separators
The Right-Tail Separation metric rewards salary-adjusted P90–P99 upside relative to projected ownership. However, the highest scores can be dominated by extremely low ownership, so we need a minimum raw-ceiling threshold.
These are my preferred actionable candidates from the first pass:
| Player | Salary | RST% | SACP | P99 |
|---|---|---|---|---|
| Owen Tippett | $4,300 | 1.8% | 20.15 | 27.53 |
| Tyson Foerster | $3,800 | 2.0% | 19.94 | 27.07 |
| Gabriel Vilardi | $4,200 | 3.0% | 21.47 | 29.00 |
| Thomas Novak | $4,100 | 3.0% | 20.03 | 27.33 |
| Ben Kindel | $4,400 | 3.0% | 20.66 | 28.19 |
| Oliver Bonk | $4,300 | 3.4% | 23.60 | 31.31 |
Owen Tippett is especially interesting: 20.15 SACP at only 1.8% projected ownership. That is a meaningful tournament profile without requiring an extreme punt.
Gabriel Vilardi is my favorite correlation-based separator because he complements two strong Winnipeg ceiling plays while preserving salary flexibility.
Oliver Bonk has an exceptional modeled defenseman ceiling for $4,300. His projection and role should be confirmed because this could represent either a major value opportunity or a source-data issue.
I would avoid automatically chasing the highest XVO scores among players projected for only two or three fantasy points. The ownership normalization currently makes some extremely low-owned punts look stronger than their absolute ceilings justify.
7. Fragile chalk and opportunity-cost analysis
The most useful chalk question isn’t simply whether a player can fail. It’s whether we can retain similar upside with a more efficient alternative.
| Higher-cost option | Alternative | Salary savings | SACP sacrificed |
|---|---|---|---|
| MacKinnon | Kyle Connor | $1,800 | 0.19 |
| McDavid | Kyle Connor | $2,300 | 2.54 |
| Kaprizov | Matt Boldy | $500 | 0.40 |
| Kucherov | Cutter Gauthier | $600 | Gain 0.30 |
These are comparisons of individual player ceilings, not position-for-position swaps; the roster construction must still satisfy DraftKings eligibility.
The most compelling is MacKinnon versus Kyle Connor. Connor preserves nearly the same modeled SACP at substantially lower salary and ownership.
McDavid remains the top raw-ceiling play, but his salary creates a larger opportunity cost than the model’s ceiling advantage necessarily justifies.
8. Single-entry versus 3-Max strategy
| Strategy | Single Entry | 3-Max |
|---|---|---|
| Primary offense | Winnipeg | Winnipeg, Utah, Colorado |
| Anchor | Kyle Connor | Connor, McDavid, Kaprizov |
| Value | Vilardi | Vilardi, Tippett, Foerster |
| Defense | Verified PP1 role | Mix PP1 ceiling and salary leverage |
| Goalie | Salary-adjusted upside | Diversify goalie outcomes |
| Leverage | One meaningful pivot | Multiple correlated scoring paths |
For single-entry, I would concentrate on a strong, salary-efficient offensive thesis rather than stacking unrelated high-XVO punts.
For 3-Max, the goal is to cover distinct game scripts. For example, Winnipeg’s top offensive group succeeding, Utah producing a concentrated power-play ceiling, or Colorado’s premium stars dominating.
9. Vegas versus solver: The next edge to uncover
The current workbook does not contain verified Vegas game totals, team implied totals, moneylines or live starting-goalie confirmations. Therefore, I cannot honestly classify these as confirmed Vegas/solver agreement opportunities yet.
But the solver gives us a useful watchlist:
- WPG–MTL: High individual ceilings and a concentrated Winnipeg stack at manageable projected ownership.
- UTA–TOR: Utah’s strong average SACP suggests an attractive offensive environment.
- VGK–PIT: Vegas leads in aggregate SACP, with Connelly showing a major value signal.
- PHI–MIN: Philadelphia’s aggregate ceiling versus low projected ownership deserves further investigation.
- COL–CBJ: Strong raw ceiling on Colorado, with potentially meaningful goalie save-volume implications.
The key is to compare each offense’s independently modeled ceiling against its Vegas implied scoring, then determine whether projected ownership has already priced in that upside.
10. Final early-edge watchlist
1
Kyle Connor
Best salary-adjusted anchor30.85 SACP · $7,500
2
Trevor Connelly
Largest value signal — verify projection28.87 SACP · $4,300
3
Gabriel Vilardi
Best correlated value21.47 SACP · 3.0% RST
4
Dylan Guenther
Utah offensive anchor27.91 SACP · 6.2% RST
5
Owen Tippett
Low-owned separator20.15 SACP · 1.8% RST
6
Jet Greaves
Salary-efficient goalie candidate30.83 SACP · $7,400
7
Oliver Bonk
High-upside defensive value — verify role23.60 SACP · $4,300
Final assessment
My strongest early strategy is to build around Winnipeg’s salary-efficient scoring correlation, with Utah and Philadelphia as alternative offensive exposures. Kyle Connor is the standout anchor by opportunity cost, while Tippett and Vilardi provide ways to differentiate without giving away too much ceiling.
Before committing exposures, the biggest priority is reconciling the questionable player/team assignments, verifying starting goalies and actual line combinations, and incorporating current Vegas markets. The present simulations also need event-level validation before their P99 estimates should be treated as calibrated probabilities.
The preliminary edge is clear enough to guide research: target concentrated offensive ceiling at a salary and ownership discount, rather than paying for the most recognizable stars across every roster spot.


Leave a Reply