Diamond Life NCAAF Solver — Excel ExportIncludes Master Solver, SACP Rankings, XVO, Ownership Leverage, Right-Tail Separation, positional rankings, game environments, and methodology.
44
Eligible players
50K
Simulations
2
Game environments
1. Slate overview: Where the early edges appear
This is a compact two-game slate featuring Ohio–Akron and Buffalo–Miami (OH).
The most interesting finding is that Buffalo offers a strong concentration of fantasy production through a small number of players, while Akron offers several attractive salary-adjusted receiving options.
| Game | O/U | Aggregate player SACP | Initial read |
|---|---|---|---|
| Ohio vs. Akron | 51.0 | 373.5 | Higher-scoring environment |
| Buffalo vs. Miami (OH) | 44.5 | 356.0 | Concentrated upside and potential leverage |
Aggregate SACP is the sum of individual ceiling scores, not a projected game fantasy total.
Our strategy should prioritize ceiling access relative to salary and ownership rather than simply stacking the game with the higher betting total.
2. Top quarterback targets
| QB | Salary | FPTS | SACP | Ownership proxy |
|---|---|---|---|---|
| Nick Poulos | $9,100 | 22.02 | 40.02 | 55.0% |
| Jason Wright | $6,600 | 15.21 | 27.14 | 37.2% |
| Brayden Roggow | $6,500 | 12.93 | 23.27 | 32.4% |
| Caleb Heavner | $5,500 | 11.50 | 20.94 | 25.3% |
Poulos is the clear raw-ceiling anchor. His P99 reaches 50.80 fantasy points, considerably ahead of the other quarterbacks. The problem is his $9,100 salary and modeled popularity.
Wright is my preferred alternative. He offers a P99 of 34.29 at $2,500 less salary, giving us substantially more roster flexibility.
Heavner is the salary-saving tournament option. At $5,500, he has the lowest ownership proxy among the four primary quarterbacks, making him interesting in Superflex constructions.
For a two-QB Superflex approach, Poulos–Wright offers the strongest combined ceiling, while Wright–Heavner creates a different salary allocation with more room for high-ceiling skill players.
3. Running backs: The strongest individual edge
| RB | Salary | SACP | P99 | Ownership proxy |
|---|---|---|---|---|
| Messiah Burch | $5,200 | 43.75 | 58.79 | 55.0% |
| Jordan Gant | $8,400 | 33.67 | 46.22 | 28.7% |
| Duncan Brune | $8,800 | 26.32 | 36.89 | 19.0% |
| Rodney Nelson | $7,200 | 23.29 | 31.98 | 17.2% |
| Terrance Shelton | $6,100 | 19.15 | 26.24 | 14.9% |
Messiah Burch — Primary RB anchor
Top SACP
Burch projects for 21.59 fantasy points at only $5,200, with a 43.75 SACP. His uploaded workload includes 27 projected touches, supporting an unusually strong volume-to-salary relationship.
His simulated P99 of 58.79 is the highest among the running backs. The field is likely to recognize the value, so he is better viewed as high-quality chalk than a contrarian play.
Gant provides the most interesting high-priced pivot. His 33.67 SACP and 46.22 P99 give him meaningful tournament-winning upside, although the $8,400 salary creates opportunity cost.
Shelton is an appealing secondary value for lineups that cannot afford two expensive running backs.
4. Wide receivers: The tournament separation engine
This is where the solver identifies the most attractive salary-adjusted upside.
| WR | Salary | SACP | P99 | Ownership proxy |
|---|---|---|---|---|
| Chance Morrow | $5,800 | 34.52 | 51.34 | 29.7% |
| Riley Neer | $4,700 | 34.38 | 51.71 | 27.2% |
| Marcel Williams | $4,500 | 33.72 | 50.67 | 27.6% |
| Kyan Mason | $3,300 | 28.13 | 42.39 | 20.1% |
| Maleek Huggins | $4,200 | 24.66 | 37.26 | 15.0% |
| Damarion Witten | $4,900 | 22.31 | 33.76 | 12.8% |
| Miles Burris | $3,700 | 21.59 | 32.76 | 12.6% |
Kyan Mason is my favorite salary-adjusted separator. At just $3,300, his 28.13 SACP and 42.39 P99 give him substantial simulated ceiling access without requiring much salary.
Neer and Williams are also extremely attractive. Both carry SACP projections above 33 while costing less than $5,000.
Morrow is the top raw-SACP receiver, but the difference between Morrow, Neer, and Williams is small enough that salary efficiency becomes especially important.
5. Ownership proxy versus right-tail separation
Selected WR right-tail separation percentiles
Model-derived percentile ranking across the 44-player slate; higher indicates stronger salary- and ownership-adjusted upside.
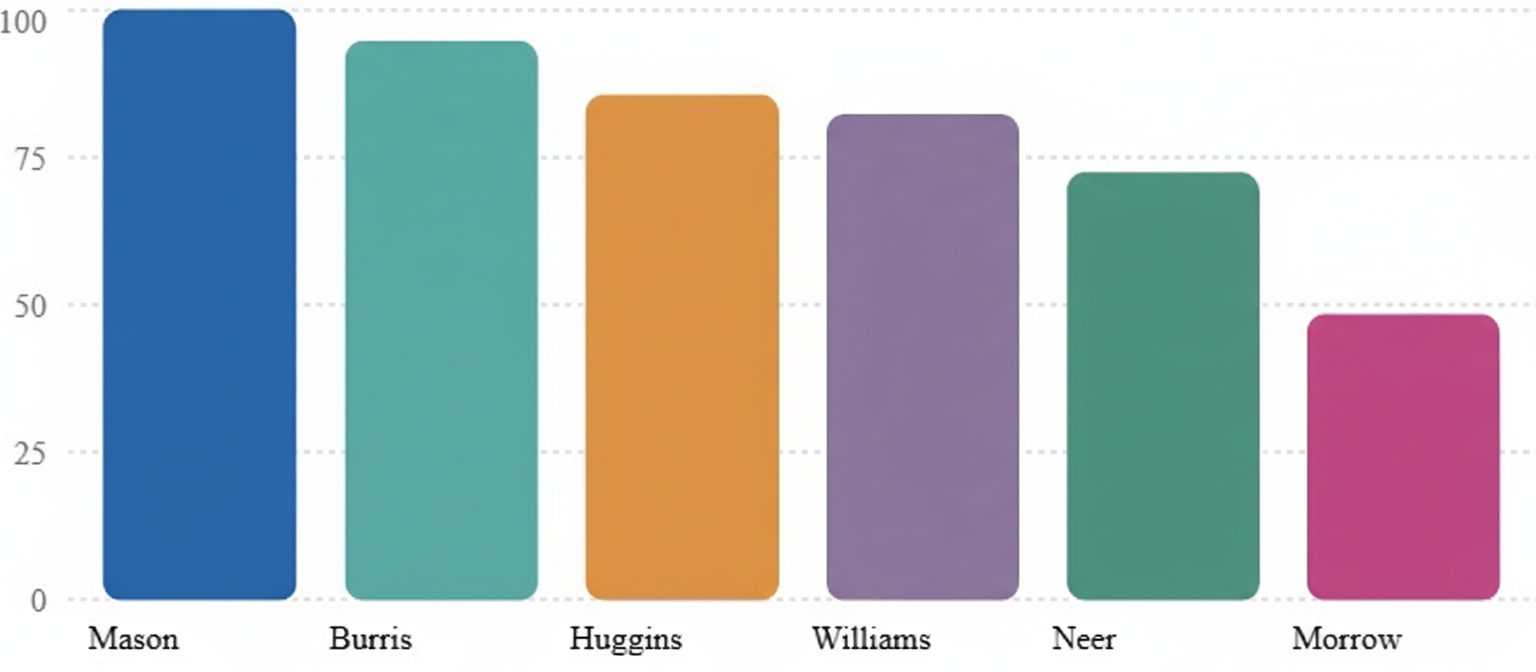
| Player | Score |
|---|---|
| Mason | 100 |
| Burris | 97.7 |
| Huggins | 93 |
| Williams | 90.7 |
| Neer | 88.4 |
| Morrow | 60.5 |
The most interesting tournament leverage group is Mason, Burris, and Huggins.
They offer different combinations of low salary, simulated upside, and ownership opportunity. Williams and Neer provide more raw ceiling, while Morrow carries the strongest receiving projection but weaker salary-adjusted separation.
6. Game environment strategy
Ohio–Akron: This is the higher-total game and deserves priority for quarterback ceiling. Poulos is the main anchor, while Neer, Williams, and Mason provide attractive receiving exposure. Gant is a strong high-salary alternative for builds that can accommodate him.
Buffalo–Miami (OH): This game has a lower betting total, but Burch and Morrow create a concentrated fantasy-upside opportunity. Wright is the quarterback to consider when seeking salary flexibility, while Huggins and Witten provide potential opposing-side exposure.
I would not automatically fade the lower-total game. Its leading players can still outperform their salaries even when the overall scoring environment is less favorable.
7. Single-entry versus 3-Max priorities
| Strategy | Preferred targets | Reason |
|---|---|---|
| Single-entry anchors | Poulos, Burch | Strongest raw ceilings |
| Salary-efficient core | Burch, Neer, Williams | High SACP relative to salary |
| 3-Max QB diversification | Wright, Roggow, Heavner | Alternatives to expensive QB chalk |
| Tournament separators | Mason, Burris, Huggins | Right-tail salary and ownership leverage |
| Expensive RB pivot | Gant | Strong upside if popular alternatives fail |
For single-entry, I would emphasize Burch’s workload and use salary-efficient receivers to make a high-ceiling quarterback construction realistic.
For 3-Max, I would diversify quarterback exposure and use the Mason/Burris/Huggins group to create meaningful differentiation.
8. Fragile chalk and opportunity cost
Poulos has the best quarterback ceiling, but his salary creates a meaningful tradeoff. If Wright approaches Poulos’s output, the $2,500 savings could be decisive.
Burch is a different situation. His combination of projection, workload, salary, and simulated ceiling makes fading him particularly risky. A Burch fade should be part of a deliberate tournament construction rather than an automatic ownership reaction.
Morrow is strong, but Neer and Williams offer comparable SACP at lower salaries. That is one of the clearest opportunity-cost decisions on the slate.
Final condensed player pool
Primary anchors: Nick Poulos, Messiah Burch
Core ceiling targets: Jason Wright, Jordan Gant, Chance Morrow, Riley Neer, Marcel Williams
Best tournament separators: Kyan Mason, Maleek Huggins, Miles Burris
Secondary pivots: Caleb Heavner, Brayden Roggow, Terrance Shelton, Damarion Witten
Important model qualifications
Ownership percentages are proxies, not observed field ownership. They are estimated from projection, salary efficiency, salary, and opportunity indicators, then normalized using approximate positional roster demand. They should be treated as relative popularity estimates, especially on this small slate.
The 50,000 draws use correlated team/game shocks and player-level volatility; they are not a fully calibrated play-by-play simulation. The extreme P99 outcomes are model scenarios, not validated probabilities of specific football outcomes. No external injury, starting-lineup, weather, or live betting-line verification was performed.
My initial slate priority is Burch for value, Poulos for quarterback ceiling, and Mason for salary-adjusted tournament separation. The most useful next decision is whether Poulos’s raw ceiling justifies the opportunity cost versus Wright in a Superflex build.


Leave a Reply