Diamond Life DFS Solves NBA 10/27/26 Main Slate – Early and Edgy (DK and FD)
DRAFT KINGS DFS ANALYTICS
DIAMOND LIFE DFS | NBA SLATE INTELLIGENCE | OCTOBER 27, 2026
NBA DFS: Finding Tournament-Winning Ceiling Where Vegas, the Solver, and Ownership Disagree
Four-game slate analysis | Game environments, Monte Carlo ceilings, ownership leverage, injury scenarios, and tournament strategy
The October 27 NBA slate presents an intriguing opportunity for tournament players. Four games, several elite spend-up options, and a significant difference between where the field is likely to concentrate and where our Diamond Life NBA DFS Solver identifies the greatest upside.
The objective isn’t simply to find the players projected to score the most fantasy points. It’s to identify players capable of delivering slate-breaking performances at ownership levels that do not fully reflect their upside.
Our Diamond Life framework evaluates 86 players with positive projections, incorporating 12,000 modeled outcomes, ceiling-adjusted projections, ownership, salary efficiency, and game correlation.
The central finding is clear: Lakers–Trail Blazers offers the strongest conventional scoring environment, but Kings–Spurs may provide the greatest tournament-winning leverage.
1. Understanding the slate: Vegas meets the Diamond Life Solver
Vegas totals tell us where scoring is expected. Point spreads help identify which games are most likely to remain competitive, protecting starter minutes and late-game production.
The Diamond Life Solver adds another layer. Through Monte Carlo modeling, it evaluates player-level ceiling distributions, Solver-Adjusted Ceiling Projection (SACP), XVO v3.1, Tail Leverage, and Right-Tail MME Separation.
By combining these signals, we can distinguish between three different types of opportunities: strong environments the field already recognizes, high-upside environments the field may be underestimating, and lower-total games containing individual players capable of outperforming expectations.
Game environment rankings
| Game | Vegas O/U | Spread | Top-5 SACP | Avg. RST% |
|---|---|---|---|---|
| LAL–POR | 234.0 | 2.0 | 296.2 | 12.6% |
| SAC–SAS | 232.5 | 18.5 | 313.3 | 8.7% |
| DET–NYK | 219.0 | 4.0 | 281.3 | 9.1% |
| BKN–BOS | 222.5 | 12.5 | 278.0 | 7.1% |
Where the solver sees concentrated ceiling
Combined SACP of the top five players in each matchup.
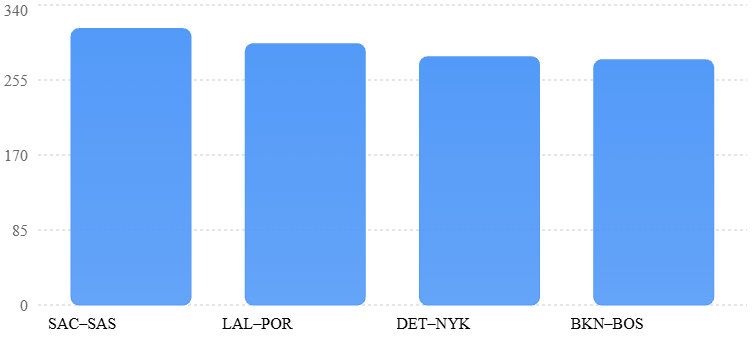
These numbers reveal something particularly important. Sacramento–San Antonio owns the highest concentration of individual ceiling despite carrying an enormous 18.5-point spread.
That creates both opportunity and risk. The solver sees upside, while Vegas warns that the game may become uncompetitive.
The most profitable strategy may be capturing that upside selectively rather than blindly stacking the entire game.
2. Game-by-game breakdown

Lakers vs. Trail Blazers
234 total | 2-point spread
The strongest all-around environment on the slate.
This matchup offers the highest projected scoring total and the closest spread. That combination supports full starter minutes and sustained fantasy production.
Luka Doncic leads the game with 78.4 SACP and 82.9 P95, but his 30.4% ownership indicates that the field already recognizes his ceiling.
Deni Avdija (55.7 SACP) and Donovan Clingan (44.8 SACP) provide alternative exposure. Clingan’s 2.6% projected ownership makes him especially interesting for large-field tournaments.
Verdict: Prioritize in single-entry and balanced tournament builds. Look for less popular pieces of the game rather than automatically following the most obvious chalk.

Kings vs. Spurs
232.5 total | 18.5-point spread
The slate’s most intriguing tournament environment.
The top five players combine for 313.3 SACP, the highest of any matchup. Yet the large spread creates significant fourth-quarter playing-time uncertainty.
Victor Wembanyama is the standout with 80.9 SACP and just 5.8% ownership. Stephon Castle and Dylan Harper offer additional low-owned ceiling exposure.
Domantas Sabonis is particularly interesting as a Sacramento bring-back. A strong performance from Sabonis could help Sacramento remain competitive, protecting the minutes of San Antonio’s highest-upside players.
Verdict: Attack selectively in GPPs. Favor ceiling-focused combinations that benefit from a competitive game script rather than excessive exposure to the same blowout risk.

Pistons vs. Knicks
219 total | 4-point spread
A lower-total game with useful contrarian opportunities.
Although the matchup has the lowest total, its close spread supports sustained starter minutes.
Cade Cunningham (63.5 SACP, 18.6% ownership) offers a compelling alternative to more popular stars. Karl-Anthony Towns carries 64.1 SACP but considerably higher ownership at 33.8%.
This is a strong example of why game totals should not be the only consideration. Individual usage concentration can create tournament-winning outcomes even in slower-scoring environments.
Verdict: Target selective one-offs. Cade is particularly appealing as an ownership-conscious alternative.

Nets vs. Celtics
222.5 total | 12.5-point spread
The least attractive full-game stacking environment.
Boston’s projected advantage creates potential starter-minute risk, while the game’s ceiling concentration ranks last.
Jayson Tatum remains a major individual exception with 75.2 SACP and 80.1 P95. However, his 40.5% projected ownership creates an opportunity-cost decision.
At that ownership, a merely strong performance may not be enough to separate a lineup from the field.
Verdict: Underweight full-game stacks while remaining open to individual ceiling plays.
3. The elite spend-ups: ceiling versus ownership
The spend-up decision is one of the most consequential choices on this slate.
| Player | SACP | P95 | RST% | Tournament role |
|---|---|---|---|---|
| Victor Wembanyama | 80.9 | 86.9 | 5.8% | Primary leverage anchor |
| Luka Doncic | 78.4 | 82.9 | 30.4% | Strongest environment anchor |
| Jayson Tatum | 75.2 | 80.1 | 40.5% | High-owned ceiling option |
| Domantas Sabonis | 73.4 | 77.7 | 19.5% | Correlated ceiling target |
| Karl-Anthony Towns | 64.1 | — | 33.8% | Popular secondary spend-up |
| Cade Cunningham | 63.5 | 67.4 | 18.6% | Contrarian alternative |
A dash indicates a percentile not established in the figures reviewed for this report.
Why Wembanyama stands out
SACP
80.9
Highest on slate
P99
114.8
Extreme modeled upside
RST%
5.8%
Low projected ownership
Wembanyama leads the slate in SACP while carrying a fraction of the ownership assigned to Doncic and Tatum.
His P99 projection of 114.8 represents an extreme modeled outcome, not a guaranteed or historically calibrated scoring probability. Nevertheless, it demonstrates the kind of right-tail access our solver is designed to identify.
The main question is whether Sacramento can keep the game competitive long enough for that ceiling to materialize.
For single-entry players prioritizing competitive-game stability, Luka remains a strong option. For large-field tournaments where differentiation is essential, Wembanyama becomes especially compelling.
4. The best right-tail separators
The Diamond Life Right-Tail MME Separation Engine measures more than raw fantasy-point potential. It incorporates upper-tail outcomes, salary-adjusted access to ceiling, volatility, and projected ownership.
Top right-tail separation scores
Higher scores indicate stronger modeled tournament separation.
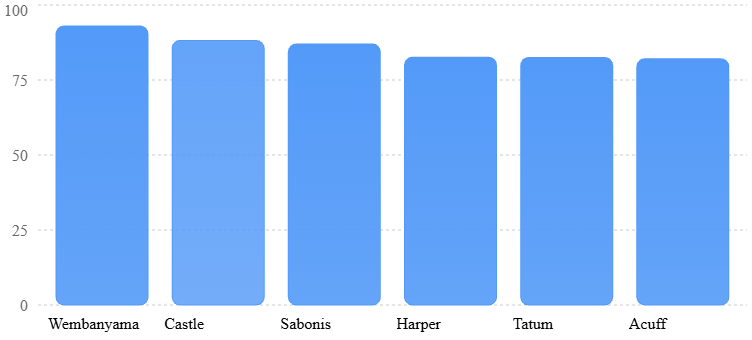
| Player | Salary | SACP | RST% | Separation |
|---|---|---|---|---|
| Wembanyama | $10,800 | 80.9 | 5.8% | 93.00 |
| Stephon Castle | $7,000 | 55.8 | 4.5% | 88.20 |
| Sabonis | $9,400 | 73.4 | 19.5% | 87.01 |
| Dylan Harper | $6,200 | 50.0 | 5.9% | 82.61 |
| Jayson Tatum | — | 75.2 | 40.5% | 82.51 |
| Darius Acuff | $6,900 | 51.5 | 5.5% | 82.10 |
The Castle–Harper opportunity
Castle and Harper stand out because their projected ownership remains below 6%, yet both show meaningful ceiling-adjusted production.
Castle offers 55.8 SACP and 59.2 P95. Harper provides 50.0 SACP and 53.4 P95 at a lower salary.
Both become especially interesting when San Antonio plays a competitive game. However, rostering multiple Spurs creates shared game-script risk, so their combined exposure should reflect the possibility of a blowout.
Darius Acuff: a potential overlooked playmaker
Acuff enters with 51.5 SACP, 54.8 P95, and only 5.5% projected ownership.
He offers an alternative route to tournament separation without requiring exposure to the most popular stars.
His appeal is strongest when salary construction allows the rest of the roster to retain strong P90–P99 upside.
5. Value plays and salary efficiency
Tournament value isn’t simply finding the cheapest player. A strong value should create enough salary flexibility to improve the rest of the roster while maintaining a realistic path to a ceiling outcome.
| Player | Salary | SACP | RST% | Role |
|---|---|---|---|---|
| Precious Achiuwa | $5,000 | 46.6 | 19.7% | Frontcourt value |
| John Collins | $5,800 | 42.7 | 16.7% | Midrange option |
| Ausar Thompson | $5,900 | 37.9 | 2.4% | Contrarian upside |
| Jrue Holiday | $5,000 | 36.6 | 26.4% | Popular salary relief |
| Scoot Henderson | $4,300 | 31.1 | 2.6% | Low-owned salary saver |
| Donovan Clingan | — | 44.8 | 2.6% | Contrarian frontcourt target |
Achiuwa offers a strong SACP relative to his salary, while Henderson provides a more aggressive salary-saving option.
Holiday has a useful baseline projection, but his 26.4% ownership makes him less appealing as a pure leverage play.
Ausar Thompson and Clingan are particularly interesting for players willing to sacrifice some median projection in pursuit of a differentiated tournament roster.
6. Injury watch: where late news can change the slate
Injury news has the potential to change this slate dramatically, particularly in games where one high-usage player controls a substantial portion of the team’s offense.
The scenarios below are conditional, not confirmed injury designations. They identify which players should be reevaluated if a relevant absence is officially reported.
| Injury scenario | Players to reassess | Strategic implication |
|---|---|---|
| Portland primary guard unavailable | Holiday, Henderson | More guard minutes and usage |
| Wembanyama or Fox unavailable | Castle, Harper, Vassell | Significant offensive redistribution |
| Tatum unavailable | White, Pritchard | Increased Boston offensive opportunity |
| Sabonis unavailable | Achiuwa, LaVine, Acuff | Sacramento usage shifts; greater blowout concern |
| Knicks high-usage starter unavailable | Hart, Bridges, Anunoby | Concentrated minutes and production |
| Detroit frontcourt absence | Collins, Ausar Thompson | Rebounding and frontcourt opportunities |
Why injury adjustments must go beyond projections
Consider a hypothetical Sabonis absence.
A traditional projection adjustment might increase opportunities for Sacramento’s remaining players. Our Diamond Life approach must also account for the potential effect on San Antonio’s game environment.
If Sacramento becomes substantially less competitive, Wembanyama’s minutes ceiling may decline even while the remaining Kings receive additional usage.
The correct process is to redistribute minutes and usage, update the game environment, and rerun the correlated simulations before making final swaps.
Until that is done, the players above are candidates for reassessment rather than confirmed injury-adjusted values.
7. Fragile chalk and ownership pivots
High ownership is not inherently bad. The problem occurs when a player needs a near-perfect outcome to justify his popularity.
| Popular target | RST% | Potential pivot | Pivot RST% | Tradeoff |
|---|---|---|---|---|
| Tatum | 40.5% | Wembanyama | 5.8% | Higher ceiling, higher salary and blowout risk |
| Luka | 30.4% | Sabonis | 19.5% | Lower raw ceiling, different game script |
| Towns | 33.8% | Cade Cunningham | 18.6% | Similar SACP, different roster position |
| Holiday | 26.4% | Scoot Henderson | 2.6% | Lower projection, greater salary relief |
These are strategic alternatives, not necessarily direct position-for-position swaps. Actual roster eligibility, salary cap, and opportunity cost must determine whether each pivot is practical.
The most important principle is to avoid fading a strong player simply because he is popular. A pivot should retain enough ceiling to justify the projection sacrificed.
8. Single-entry, 3-Max, and MME strategy
Single Entry — Protect ceiling without excessive risk
Prioritize the LAL–POR environment because of its high total and competitive spread. Luka offers a strong anchor, while Cade or a selective SAC–SAS player can provide differentiation.
Avoid excessive dependence on multiple players from games carrying large blowout spreads.
3-Max — Build around different game scripts
Use three distinct tournament theses: a competitive LAL–POR shootout, a SAC–SAS game where the Kings exceed expectations, and a lower-owned DET–NYK ceiling outcome.
Diversification should come from different paths to winning, not simply changing one player between otherwise identical builds.
Large-Field MME — Pursue separation
Wembanyama, Castle, Harper, Acuff, and selective low-owned Portland pieces offer interesting right-tail access.
Maintain salary realism, account for correlated failure scenarios, and avoid overloading lineups with players who all require the same favorable game script.
9. Final Diamond Life player pool
This is a condensed tournament pool, not a proposed lineup.
| Category | Players |
|---|---|
| Elite anchors | Wembanyama, Doncic, Tatum |
| Secondary ceiling | Sabonis, Towns, Cunningham |
| Right-tail separators | Castle, Harper, Acuff |
| Midrange targets | Avdija, Derrick White, Josh Hart |
| Value candidates | Achiuwa, Collins, Holiday |
| Contrarian salary relief | Henderson, Ausar Thompson, Clingan |
The final selection should depend on the contest format, confirmed player availability, updated ownership, and salary-cap opportunity cost.
10. The Diamond Life final verdict

TOP TOURNAMENT ANCHOR
Victor Wembanyama
The slate’s highest SACP, exceptional P99 access, and just 5.8% projected ownership create the strongest individual leverage case. The major risk remains the large point spread.

BEST ENVIRONMENT ANCHOR
Luka Doncic
A strong combination of ceiling and competitive-game conditions. His ownership is the principal tournament consideration.

BEST SECONDARY SEPARATOR
Stephon Castle
Strong SACP, excellent Right-Tail Separation, and ownership below 5% make him one of the more interesting midrange tournament targets.
Closing perspective
The key to this slate is understanding that the best fantasy environment and the best tournament environment are not necessarily the same.
Lakers–Trail Blazers offers the clearest scoring and competitiveness profile. Kings–Spurs offers exceptional individual ceiling concentration at ownership levels that may not fully reflect the opportunity. Pistons–Knicks provides selective contrarian value, while Nets–Celtics appears less attractive for full-game stacking.
Our goal is to exploit those differences without ignoring the risks that created them.
The Diamond Life approach is to identify where Vegas forecasts scoring, the solver confirms upper-tail potential, and the field has not fully priced in the opportunity.
That is where tournament separation becomes possible.
FAN DUEL DFS ANALYTICS
DIAMOND LIFE SPORTS | NBA DFS RESEARCH | OCTOBER 27, 2026
An advanced breakdown of tonight’s slate using the Diamond Life NBA Solver, Monte Carlo simulations, ceiling-adjusted projections, game environments, and ownership-based risk management.
The difference between building a competitive NBA DFS lineup and building one capable of winning a large-field tournament often comes down to one question:
Where does the field underestimate the probability of an exceptional fantasy performance?
That is the central objective of the Diamond Life NBA DFS Solver.
For the October 27 slate, our research combines projected fantasy production, salary, ownership, Vegas scoring environments, and Monte Carlo outcome distributions to identify the players and game situations most capable of producing tournament separation.
Our analysis covers four games and 86 players, with 12,000 modeled outcomes per player. The primary metrics include Solver-Adjusted Ceiling Projection (SACP), XVO v3.1, Tail Leverage, and Right-Tail MME Separation.
Rather than simply identifying the highest projected scorers, we are searching for situations where three important signals intersect:
- Vegas anticipates a productive scoring environment.
- Our solver independently identifies strong P90–P99 fantasy outcomes.
- Projected ownership has not fully adjusted to the opportunity.
This approach reveals several compelling tournament opportunities, particularly involving Victor Wembanyama, Luka Dončić, Stephon Castle, and Jayson Tatum.
1. Understanding the slate’s scoring environments
HIGHEST GAME TOTAL
234.0
Lakers vs. Trail Blazers2-point spread
HIGHEST COMBINED SACP
753.0
Kings vs. Spurs18.5-point spread
MOST COMPETITIVE GAME
2.0
Lakers vs. Trail BlazersProjected point spread
BIGGEST BLOWOUT CONCERN
18.5
Kings vs. SpursProjected point spread
Complete game environment rankings
| Rank | Game | Vegas total | Spread | Combined SACP |
|---|---|---|---|---|
| 1 | LAL @ POR | 234.0 | 2.0 | 745.4 |
| 2 | SAC @ SAS | 232.5 | 18.5 | 753.0 |
| 3 | DET @ NYK | 219.0 | 4.0 | 714.1 |
| 4 | BKN @ BOS | 223.0 | 12.5 | 715.4 |
Figures reflect the slate data used in our discovery. Combined SACP is the sum of individual modeled player ceiling scores, not an expected game fantasy total. Vegas figures have not been independently refreshed.
Lakers–Trail Blazers: The best overall game environment
The Lakers–Trail Blazers matchup stands out because its 234-point total is accompanied by a remarkably competitive two-point spread.
That combination matters enormously in NBA DFS.
A high total creates opportunities for fantasy production, while a competitive game increases the likelihood that star players remain on the floor deep into the fourth quarter.
Luka Dončić is the primary beneficiary of this environment, carrying a 79.45 SACP with an 87.5-point modeled P99.
However, his projected ownership of 78.8% presents a significant tournament challenge.
A player rostered by nearly four out of five opponents can still be essential to a winning lineup, but his performance must justify the salary and the opportunity cost of using such a popular roster spot.
Diamond Life assessment: This is the slate’s most dependable environment for pursuing multiple strong fantasy performances, but the most obvious play is also the most heavily owned.
Kings–Spurs: The highest ceiling, with substantial risk

The Kings–Spurs matchup carries a 232.5 total and the highest combined SACP on the slate at 753.0.
Victor Wembanyama leads all players with an 83.88 SACP, while Domantas Sabonis follows with 70.88.
The concern is the 18.5-point spread. If the game becomes noncompetitive, the players with the highest ceilings may lose critical fourth-quarter minutes.
Wembanyama is particularly interesting because his projected ownership is just 10.8%.
That makes him one of the slate’s strongest combinations of raw ceiling and potential tournament differentiation.
The solver sees a 93.9-point P99 outcome, substantially higher than Dončić’s 87.5.
The question is not whether Wembanyama has tournament-winning upside. It is whether his opportunities remain intact long enough for that ceiling to materialize.
Diamond Life assessment: Excellent for selective exposure to exceptional individual upside, but a weaker choice for an aggressive full-game stack.
Pistons–Knicks: The overlooked competitive environment
Detroit–New York carries the lowest total at 219 points, but its four-point spread creates an attractive competitive game script.
Karl-Anthony Towns, Cade Cunningham, and Jalen Brunson all possess meaningful modeled ceilings.
The matchup is especially useful for identifying players who may receive stable minutes while other tournament participants concentrate on the higher-total games.
This does not automatically make Detroit–New York an underowned game. Cunningham’s 48.2% RST% demonstrates that the field already recognizes some of the opportunity.
Diamond Life assessment: Strong secondary environment for selective exposure, especially when a player provides superior salary-adjusted ceiling access.
Nets–Celtics: Individual leverage over game stacking
Brooklyn–Boston has a 223-point total and a 12.5-point spread.
The potential for a noncompetitive game makes this our lowest-priority full-game stacking environment.
However, Jayson Tatum’s 72.33 SACP and 1.7% projected ownership create a very different opportunity at the individual level.
A player can be attractive for tournaments even when his game environment is not.
That distinction is essential to our approach.
2. The elite ceiling hierarchy
Top eight players by Solver-Adjusted Ceiling Projection
Modeled fantasy-point ceiling scores
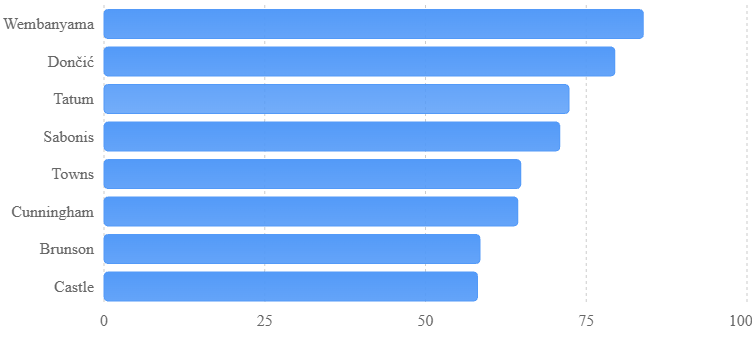
These rankings show why simply selecting the highest projected fantasy scorers is insufficient.
Wembanyama leads the slate in SACP, but his game has meaningful blowout risk. Dončić has a more favorable competitive environment, but exceptionally high ownership.
Tatum offers tremendous differentiation, although his team’s projected advantage introduces similar minutes concerns.
Each player has a different path to becoming the optimal tournament anchor.
3. Monte Carlo simulations: Where tournament separation begins
Our simulation engine estimates a distribution of possible fantasy outcomes rather than relying on a single projection.
The P15 outcome represents a lower-tail result, while P95 and P99 describe increasingly extreme upper-tail outcomes.
| Player | P15 | P95 | P99 | Std. dev. |
|---|---|---|---|---|
| Wembanyama | 33.4 | 81.1 | 93.9 | 17.7 |
| Dončić | 31.8 | 76.0 | 87.5 | 16.5 |
| Tatum | 30.4 | 71.0 | 81.3 | 15.1 |
| Sabonis | 32.1 | 70.0 | 79.6 | 14.1 |
| Towns | 29.2 | 64.2 | 73.3 | 13.1 |
| Cunningham | 28.4 | 64.1 | 72.6 | 13.3 |
These are scenario-model estimates, not historically calibrated probabilities. They should be reassessed after injury and minutes updates.
Why the P99 outcomes matter
Consider the difference between Wembanyama and Dončić.
Wembanyama’s modeled P99 is 6.4 fantasy points higher, and his projected ownership is 68 percentage points lower.
In a tournament where thousands of opponents are competing for the same top prize, that difference in ownership can be enormously valuable.
However, lower ownership alone does not establish that Wembanyama is the better play. Salary, positional flexibility, projected minutes, and the probability of reaching a winning score all matter.
The solver’s job is to evaluate those tradeoffs rather than simply reward low ownership.
4. The ownership leverage opportunities
Projected RST% from the uploaded slate
Ownership concentration among key ceiling plays
Lower ownership creates differentiation, but must be weighed against probability of success
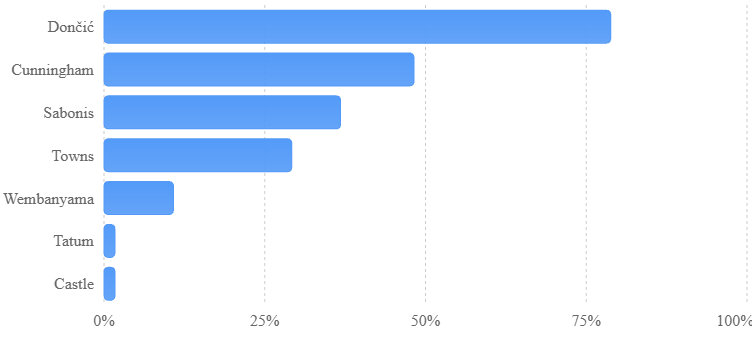
Wembanyama: The premium leverage anchor

83.88 SACP
93.9 P99 · 10.8% RST%
Wembanyama combines the highest raw modeled ceiling on the slate with substantially lower ownership than Dončić. His primary risk is a reduced workload if the Spurs game becomes lopsided.
Dončić: The premium chalk anchor
79.45 SACP
87.5 P99 · 78.8% RST%
Dončić benefits from the strongest competitive scoring environment. The concern is not his ceiling but how little lineup differentiation he provides at such high ownership.
Tatum: The extreme contrarian candidate

72.33 SACP
81.3 P99 · 1.7% RST%
Tatum offers substantial modeled upside at exceptionally low ownership. His availability and projected role must be confirmed before treating this as actionable leverage.
5. The secondary playmakers who can separate lineups
The next objective is identifying players who can outperform their salaries without consuming an elite share of the salary cap.
| Player | Salary | SACP | RST% | Right-Tail Separation |
|---|---|---|---|---|
| Stephon Castle | $6,700 | 58.09 | 1.7% | 8.52 |
| Dylan Harper | $6,100 | 52.19 | 1.7% | 8.41 |
| Mikal Bridges | $4,200 | 41.05 | 1.7% | 9.61 |
| Damian Lillard | $7,500 | 56.60 | 1.7% | 7.42 |
| Derrick White | $5,800 | 50.67 | 35.4% | 6.49 |
| Darius Acuff | $6,800 | 51.39 | 9.1% | 7.02 |
| Daniss Jenkins | $4,800 | 34.50 | 5.3% | 6.88 |
| Payton Pritchard | $5,300 | 45.16 | 28.1% | 6.78 |
Castle and Harper: Two intriguing San Antonio options

Stephon Castle
$6,700 · 58.09 SACP · 1.7% RST%
Castle has a compelling combination of ceiling, manageable salary, and minimal projected ownership.

Dylan Harper
$6,100 · 52.19 SACP · 1.7% RST%
Harper provides another potential route into the Spurs’ high-scoring environment without paying for the most expensive players.
The important consideration is correlation. Multiple Spurs players can produce strong fantasy scores together, but an 18.5-point spread raises the risk that several lose valuable late-game minutes simultaneously.
That makes individual exposure more appealing than blindly stacking the entire offense.
Bridges: A salary-adjusted separator
Mikal Bridges stands out with a $4,200 salary, 41.05 SACP, and 9.61 Right-Tail Separation score.
This is the kind of player our opportunity-cost engine is designed to identify.
A relatively inexpensive player does not need to match an elite star’s raw fantasy score to become a tournament-winning piece. He needs to deliver enough production relative to his salary to unlock higher-ceiling roster construction elsewhere.
Bridges deserves attention on that basis, subject to confirmation of his minutes and role.
6. Injury intelligence: Where the slate can change
Injury news is one of the most powerful drivers of late ownership inefficiency.
When a high-usage player is ruled out, the resulting opportunity is rarely distributed evenly. Some teammates gain minutes, others gain ball-handling responsibilities, and others simply become more attractive because their salaries have not adjusted.
Our current solver data does not include a verified live injury-status feed, so the following are conditional swap scenarios rather than confirmed injury reports.
Lakers: Dončić or Reaves availability
If Dončić is ruled out or restricted, Austin Reaves becomes the primary usage candidate. Quentin Grimes and Collin Sexton could offer cheaper alternatives if their minutes or responsibilities increase.
| Candidate | Base SACP | Base minutes |
|---|---|---|
| Austin Reaves | 56.06 | 35 |
| Quentin Grimes | 32.49 | 27 |
| Collin Sexton | 25.97 | 18 |
Solver response: Redistribute ball-handling usage, revise minutes, and rerun P95/P99 rather than applying an automatic percentage boost.
Spurs: Wembanyama and frontcourt availability
If Wembanyama misses time, Castle and Harper could receive additional offensive opportunity. Luke Kornet could become relevant if the frontcourt rotation changes.
| Candidate | Base SACP | RST% |
|---|---|---|
| Castle | 58.09 | 1.7% |
| Harper | 52.19 | 1.7% |
| Kornet | 23.48 | 4.7% |
Solver response: Model frontcourt minutes and guard usage separately. The highest-value beneficiary may not be the direct positional replacement.
Celtics: Tatum availability
If Tatum misses time, Derrick White and Payton Pritchard become primary candidates for increased offensive responsibilities, while Sam Hauser could benefit from additional minutes.
| Candidate | Base SACP | RST% |
|---|---|---|
| Derrick White | 50.67 | 35.4% |
| Payton Pritchard | 45.16 | 28.1% |
| Sam Hauser | 23.77 | 8.8% |
Solver response: Reassess usage and minutes while accounting for Boston’s already substantial blowout risk.
Pistons: Cunningham availability
If Cunningham is unavailable, Daniss Jenkins becomes a possible low-cost beneficiary.
His baseline is 34.50 SACP at $4,800 and 5.3% ownership.
Solver response: Require confirmation of a larger rotation role before making a significant upgrade. Additional minutes are not necessarily equivalent to increased fantasy production per minute.
7. Risk management: Avoiding attractive traps
A major purpose of our solver is to distinguish ceiling opportunity from unnecessary risk.
The most important concerns on this slate are:
Blowout-adjusted minutes. Sacramento–San Antonio and Brooklyn–Boston both feature substantial spreads. These environments may produce explosive individual performances, but there is a greater risk of lost late-game opportunities.
Ownership concentration. Dončić’s 78.8% RST% and Cunningham’s 48.2% RST% create potential lineup duplication concerns. They should be evaluated against alternative players with comparable ceiling access, not faded automatically.
Injury-driven projection errors. A replacement player’s original SACP is not his injury-adjusted ceiling. Every meaningful change in minutes or usage requires another simulation pass.
Correlation risk. Stacking several players from the same game can create a path to simultaneous ceiling performances, but it can also concentrate exposure to a single poor game script.
False value. Low salary and low ownership are not enough. A player still needs credible minutes, usage, and upper-tail scoring access.
8. Single-entry versus 3-Max tournament strategy
Single-entry
Risk-adjusted ceiling
The objective is to maximize tournament-winning upside without relying on too many unlikely events occurring simultaneously.
Preferred approach: Begin with the strong LAL–POR environment, compare Dončić against Wembanyama as the anchor decision, and use selective salary-efficient plays to create differentiation.
A single-entry build does not need five contrarian players. One or two well-supported leverage decisions can be enough.
3-Max
Different winning scripts
Three entries should represent distinct paths to the top of the leaderboard rather than minor variations of the same roster.
| Approach | Primary concept |
|---|---|
| Build 1 | LAL–POR competitive-game ceiling |
| Build 2 | Wembanyama-led SAC–SAS leverage |
| Build 3 | Selective DET–NYK or BOS contrarian ceiling |
This is a strategic allocation framework, not three optimized lineups.
Large-field MME
Right-tail separation
Larger tournaments place greater value on outcomes that are both exceptional and relatively uncommon.
Wembanyama, Castle, Harper, and conditional Tatum exposure provide potential paths to that differentiation.
However, exposure should reflect modeled upside and downside rather than ownership alone.
9. Diamond Life final player watchlist
The following rankings combine our ceiling findings, Vegas research, and ownership considerations. They are editorial priorities, not a newly calculated composite score.
| Priority | Player | Role | Main reason |
|---|---|---|---|
| 1 | Wembanyama | Leverage anchor | Highest SACP, low ownership |
| 2 | Dončić | Raw-ceiling anchor | Best competitive game |
| 3 | Tatum | Contrarian spend-up | High ceiling, extremely low RST% |
| 4 | Castle | Midrange separator | Strong SACP at 1.7% ownership |
| 5 | Harper | Midrange separator | Salary-adjusted Spurs exposure |
| 6 | Sabonis | High-ceiling alternative | 70.88 SACP |
| 7 | Towns | Competitive-game anchor | Strong DET–NYK ceiling |
| 8 | Bridges | Value separator | Strong salary-adjusted separation |
| 9 | Brunson | Secondary spend-up | Competitive-game environment |
| 10 | Cunningham | Popular ceiling play | Strong SACP, higher ownership |
All selections remain conditional on official availability, role, and updated ownership.
10. Final verdict: The edge is in the disagreement
The October 27 NBA slate provides a useful example of why tournament strategy must extend beyond basic projections and game totals.
Lakers–Trail Blazers offers the strongest combination of Vegas scoring and game competitiveness. Dončić is an outstanding raw-ceiling candidate, but his ownership makes it difficult to gain separation without making strong decisions elsewhere.
Kings–Spurs has the highest combined modeled ceiling and arguably the most compelling individual tournament opportunity in Wembanyama. The challenge is managing the risk associated with an 18.5-point spread.
Detroit–New York offers a competitive secondary environment, while Brooklyn–Boston illustrates how an unattractive game-stack situation can still contain an intriguing individual leverage play.
The most valuable discovery is that the strongest tournament opportunities emerge when scoring expectations, independent ceiling projections, salary efficiency, and ownership all point toward an advantage the field may not fully recognize.
Our leading research priorities are Wembanyama as a premium leverage anchor, Dončić as the benchmark raw-ceiling play, and Castle and Harper as potential lower-owned secondary contributors.
Injury news remains the most important unresolved variable. Official statuses, confirmed starting lineups, and revised minutes projections should be incorporated before finalizing any DFS decisions.
The Diamond Life philosophy remains straightforward:
We are not trying to predict who scores the most fantasy points on average. We are trying to identify which realistic combinations of players can produce exceptional outcomes at ownership levels that create meaningful tournament separation.


Leave a Reply