Diamond Life DFS Casino Solves NFL Week 6 – Deeper Dive! (DK AND FD Week 6 Main Slates)
Draft Kings Week 6 Main SLate
General discussion: Game environments and slate dynamics
The central theme of this slate is elite offensive ceiling concentrated around the Rams, Bills, Falcons and Patriots, with several opportunities to gain leverage by choosing lower-owned quarterbacks, alternative receivers and differentiated game stacks.
The solver’s strongest initial offensive environments are:
| Rank | Offense | Aggregate SACP |
|---|---|---|
| 1 | LAR | 187.89 |
| 2 | BUF | 161.92 |
| 3 | ATL | 153.81 |
| 4 | NE | 152.26 |
| 5 | KC | 148.63 |
Three major roster-construction decisions will influence tournament results:
- Puka Nacua versus the field: His 48.06 P95 is outstanding, but 41.4% projected ownership makes him a major source of lineup duplication.
- Premium RB allocation: Bijan Robinson, Jonathan Taylor, Kenneth Walker and Kyren Williams all have substantial right-tail access. Paying for multiple expensive RBs can constrain quarterback stacking options.
- Quarterback leverage: Josh Allen and Matthew Stafford lead the ceiling rankings, while Drake Maye and Patrick Mahomes provide alternative routes to competitive upside. Huntley becomes a speculative option under our custom scenario.
Our analysis uses RST% as the authoritative ownership source. SACP measures modeled individual-player ceiling access; team SACP totals are descriptive aggregates, not directly simulated correlated game outcomes.
1. Top solver plays by position
Rankings below use SACP as the primary metric, with P95 and RST% providing the ceiling and ownership context.
Quarterbacks
| Rank | QB | Salary | P95 | SACP | RST% |
|---|---|---|---|---|---|
| 1 | Josh Allen | $9,500 | 41.26 | 37.41 | 14.5% |
| 2 | Matthew Stafford | $7,800 | 36.34 | 33.31 | 12.8% |
| 3 | Drake Maye | $8,000 | 34.52 | 31.51 | 8.9% |
| * | Tyler Huntley | TBD | TBD | 30.00* | TBD |
| 4 | Patrick Mahomes | $8,200 | 31.38 | 28.53 | 5.4% |
| 5 | Kirk Cousins | $6,800 | 30.27 | 27.85 | 6.9% |
*Huntley’s 30.00 SACP is your custom assumption, not a calculated solver result. He is excluded from the formal ranking until salary and ownership are supplied. Lamar Jackson is excluded.
QB priority: Stafford offers the best balance of ceiling and salary among the top three. Maye is an appealing alternative, while Mahomes is a lower-owned tournament pivot.
Running backs
| Rank | RB | Salary | P95 | SACP | RST% |
|---|---|---|---|---|---|
| 1 | Bijan Robinson | $9,300 | 51.90 | 48.49 | 29.8% |
| 2 | Jonathan Taylor | $8,700 | 42.95 | 39.40 | 30.7% |
| 3 | Kenneth Walker | $8,900 | 40.54 | 37.54 | 25.0% |
| 4 | Kyren Williams | $8,100 | 38.91 | 36.08 | 25.0% |
| 5 | James Cook | $8,400 | 31.64 | 29.21 | 13.3% |
| 6 | Chuba Hubbard | $6,800 | 31.01 | 29.05 | 15.4% |
| 7 | Derrick Henry | $9,100 | 30.67 | 28.44 | 7.9% |
| 8 | Rhamondre Stevenson | $6,300 | 27.64 | 25.76 | 15.5% |
| 9 | Jaylen Warren | $7,300 | 26.56 | 24.58 | 9.1% |
| 10 | Bucky Irving | $7,500 | 26.07 | 24.36 | 5.7% |
RB priority: Bijan is the top ceiling anchor. Taylor, Walker and Kyren are viable alternatives, while Hubbard and Stevenson offer salary flexibility. Henry is a lower-owned, high-variance alternative, although his modeled ceiling trails the top four.
Wide receivers
| Rank | WR | Salary | P95 | SACP | RST% |
|---|---|---|---|---|---|
| 1 | Puka Nacua | $9,000 | 48.06 | 44.59 | 41.4% |
| 2 | Drake London | $7,600 | 39.40 | 37.47 | 24.3% |
| 3 | Davante Adams | $7,200 | 32.15 | 30.30 | 23.6% |
| 4 | Chris Olave | $8,200 | 31.17 | 29.23 | 17.2% |
| 5 | Zay Flowers | $7,500 | 30.47 | 28.64 | 15.5% |
| 6 | Garrett Wilson | $7,300 | 27.17 | 25.62 | 13.4% |
| 7 | DJ Moore | $6,700 | 26.54 | 25.13 | 11.1% |
| 8 | Rashee Rice | $7,000 | 24.92 | 23.69 | 5.4% |
| 9 | Michael Wilson | $6,400 | 24.96 | 23.52 | 15.9% |
| 10 | DK Metcalf | $6,800 | 24.31 | 23.00 | 9.5% |
WR priority: Puka has the highest raw ceiling, but London is a meaningful alternative. Rice and DK Metcalf are potential ownership separators. Flowers requires renewed evaluation with Huntley starting.
Tight ends
| Rank | TE | Salary | P95 | SACP | RST% |
|---|---|---|---|---|---|
| 1 | Brock Bowers | $8,300 | 30.46 | 29.08 | 8.7% |
| 2 | Trey McBride | $7,400 | 29.66 | 28.53 | 9.6% |
| 3 | Isaiah Likely | $5,500 | 23.73 | 22.91 | 9.8% |
| 4 | Tyler Warren | $5,700 | 22.65 | 21.89 | 7.7% |
| 5 | Travis Kelce | $5,400 | 21.96 | 21.21 | 7.3% |
| 6 | Dalton Kincaid | $5,900 | 20.32 | 19.56 | 5.0% |
| 7 | Juwan Johnson | $5,100 | 20.14 | 19.50 | 6.7% |
| 8 | Dallas Goedert | $5,100 | 20.02 | 19.33 | 5.6% |
| 9 | Harold Fannin | $5,200 | 19.41 | 18.77 | 6.2% |
| 10 | Pat Freiermuth | $5,000 | 17.77 | 17.08 | 5.2% |
TE priority: Bowers is the premium separator, McBride offers similar modeled ceiling for less salary, and Kelce or Kincaid can help differentiate more balanced constructions.
Defenses
| Rank | DEF | Salary | P95 | SACP | RST% |
|---|---|---|---|---|---|
| 1 | Baltimore | $4,900 | 19.66 | 19.46 | 4.7% |
| 2 | New England | $4,500 | 19.29 | 18.94 | 9.8% |
| 3 | Indianapolis | $4,700 | 19.02 | 18.60 | 4.2% |
| 4 | Kansas City | $4,600 | 19.00 | 18.48 | 12.7% |
| 5 | Carolina | $3,800 | 18.39 | 18.00 | 12.7% |
| 6 | Los Angeles Rams | $4,300 | 18.16 | 17.69 | 10.2% |
| 7 | Pittsburgh | $4,800 | 18.07 | 17.59 | 10.8% |
| 8 | New Orleans | $3,700 | 14.36 | 14.04 | 6.8% |
| 9 | New York Giants | $3,900 | 14.15 | 13.86 | 2.8% |
| 10 | Tampa Bay | $3,200 | 13.56 | 13.40 | 2.9% |
DEF priority: Baltimore and Indianapolis offer strong modeled upside at relatively low ownership. Tampa Bay is a salary-saving contrarian option.
2. Best spend-ups
| Priority | Player | Salary | SACP | RST% | Tournament role |
|---|---|---|---|---|---|
| 1 | Bijan Robinson | $9,300 | 48.49 | 29.8% | Highest ceiling anchor |
| 2 | Puka Nacua | $9,000 | 44.59 | 41.4% | Elite stack centerpiece |
| 3 | Jonathan Taylor | $8,700 | 39.40 | 30.7% | High-floor/high-ceiling RB |
| 4 | Josh Allen | $9,500 | 37.41 | 14.5% | Premium QB ceiling |
| 5 | Kenneth Walker | $8,900 | 37.54 | 25.0% | RB ceiling alternative |
| 6 | Brock Bowers | $8,300 | 29.08 | 8.7% | Positional differentiation |
Bijan Robinson is my preferred individual ceiling anchor. Puka is extremely strong, but his popularity means the rest of a Puka lineup should be constructed with ownership in mind.
Bowers is particularly interesting because he offers a premium salary allocation at a position where many opponents may choose to save.
3. Best values
| Player | Pos | Salary | P95 | SACP | RST% |
|---|---|---|---|---|---|
| Kirk Cousins | QB | $6,800 | 30.27 | 27.85 | 6.9% |
| Chuba Hubbard | RB | $6,800 | 31.01 | 29.05 | 15.4% |
| Rhamondre Stevenson | RB | $6,300 | 27.64 | 25.76 | 15.5% |
| DJ Moore | WR | $6,700 | 26.54 | 25.13 | 11.1% |
| Isaiah Likely | TE | $5,500 | 23.73 | 22.91 | 9.8% |
| Travis Kelce | TE | $5,400 | 21.96 | 21.21 | 7.3% |
| Dallas Goedert | TE | $5,100 | 20.02 | 19.33 | 5.6% |
My preferred value combination: Hubbard or Stevenson at RB, DJ Moore at WR, and Kelce or Goedert at TE.
Likely’s original value score is strong, but I would downgrade confidence in that projection until Baltimore’s passing distribution is adjusted for Huntley.
4. Best sleepers/right-tail separators
| Player | Pos | P95 | SACP | RST% | Assessment |
|---|---|---|---|---|---|
| Patrick Mahomes | QB | 31.38 | 28.53 | 5.4% | Premium QB leverage |
| Kirk Cousins | QB | 30.27 | 27.85 | 6.9% | Low-owned salary relief |
| Bucky Irving | RB | 26.07 | 24.36 | 5.7% | Contrarian RB |
| Derrick Henry | RB | 30.67 | 28.44 | 7.9% | TD-driven ceiling |
| Rashee Rice | WR | 24.92 | 23.69 | 5.4% | KC stack separator |
| A.J. Brown | WR | 23.74 | 22.60 | 2.9% | Aggressive WR pivot |
| Dalton Kincaid | TE | 20.32 | 19.56 | 5.0% | BUF stack alternative |
| Indianapolis | DEF | 19.02 | 18.60 | 4.2% | Defensive leverage |
Three separators worth prioritizing:

Patrick Mahomes — QB leverage
A 31.38 P95 at 5.4% ownership makes Mahomes a strong alternative to the higher-owned quarterback tier. He is especially interesting when paired with Rashee Rice or Travis Kelce.

Rashee Rice — WR leverage
Rice carries a lower modeled ceiling than Puka or London, but his 5.4% ownership gives him a different tournament profile. The Mahomes–Rice pairing is worth testing in correlated builds.

Derrick Henry — Baltimore leverage
With Huntley replacing Lamar, Henry’s workload and touchdown distribution warrant renewed modeling. His original 7.9% ownership offers differentiation, but the 28.44 SACP is still the pre-adjustment score.
5. Top five game environments
After reviewing the team-level worksheet, the following are the five highest combined offensive SACP environments. These figures correct the combined totals quoted earlier.
| Rank | Matchup | Combined SACP | Best use |
|---|---|---|---|
| 1 | LAR vs. ARI | 313.25 | Best overall ceiling stack |
| 2 | BUF vs. LV | 304.21 | Premium QB + bring-back |
| 3 | ATL vs. CHI | 291.27 | Skill-position concentration |
| 4 | NE vs. NYJ | 277.56 | Mid-owned QB stack |
| 5 | NO vs. NYG | 272.41 | Contrarian game stack |
These are sums of individual SACP values for both offenses, not independent game-level simulations. The slate data’s team assignments and game contexts should be validated before contest entry.

1. LAR–ARI — Best overall stack ceiling
Stafford, Puka and Kyren provide several routes to upside. McBride and Michael Wilson are the principal Arizona bring-back candidates. This is my first environment to investigate for a full onslaught.

2. BUF–LV — Best premium QB construction
Allen is the highest-ranked active QB. Bowers provides an attractive opposing piece, while Cook and Kincaid offer alternative Bills correlations.

3. ATL–CHI — Best skill-position concentration
Bijan and London have tremendous modeled upside. DJ Moore is an interesting opposing receiver. However, pairing expensive teammates without the quarterback can reduce the benefit of traditional passing-stack correlation.

4. NE–NYJ — Strong QB leverage opportunity
Maye has 31.51 SACP at 8.9% ownership. Garrett Wilson provides an opposing piece, making this worth exploring as a less popular game stack.

5. NO–NYG — Contrarian stacking environment
Shough, Olave and Juwan Johnson form a potential lower-cost stack. This is a more speculative environment with a weaker individual ceiling profile than the Rams or Bills.
6. Best full onslaught/game-stack environments
A full onslaught should have more than a high game total. We want multiple players capable of reaching upper-percentile outcomes in the same game script, ideally without excessive combined ownership.
| Priority | Environment | Suggested structure | Risk |
|---|---|---|---|
| 1 | LAR–ARI | Stafford + Puka + Adams, McBride bring-back | Expensive and potentially duplicated |
| 2 | BUF–LV | Allen + Kincaid + another BUF pass catcher, Bowers bring-back | Allen’s salary |
| 3 | ATL–CHI | Cousins + London, DJ Moore bring-back; Bijan optional | Offensive production may concentrate in rushing |
| 4 | NE–NYJ | Maye + NE receiver, Garrett Wilson bring-back | NE pass-catcher ceiling needs validation |
| 5 | KC–LAC | Mahomes + Rice + Kelce, LAC bring-back | Lower aggregate game ceiling |
The KC–LAC environment is an alternative onslaught target rather than a top-five combined-SACP game. Its appeal comes from the relatively low ownership of Mahomes and Rice.
My preferred full onslaught: LAR–ARI for raw upside.
My preferred leverage onslaught to investigate: KC–LAC, because it can be constructed around lower-owned offensive pieces. The LAC bring-back still needs to be identified from the eligible player pool.
7. Recommended bring-back structures
| Primary stack | Bring-back | Construction idea |
|---|---|---|
| Stafford + Puka | Trey McBride | Premium passing correlation |
| Stafford + Adams | Michael Wilson | Alternative Rams receiver exposure |
| Allen + Kincaid | Brock Bowers | TE-heavy game correlation |
| Cousins + London | DJ Moore | Passing-game stack |
| Maye + NE receiver | Garrett Wilson | QB stack with opposing WR |
| Mahomes + Rice | LAC skill player | Lower-owned game-stack candidate |
| Shough + Olave | NYG skill player | Contrarian construction |
For SE, I prefer QB + one primary receiver + one opposing bring-back, where the opposing player has independent ceiling value.
For 3-Max, I would test QB + two pass catchers + one bring-back, but only where the projected game script supports concentrated passing production.
Avoid forcing bring-backs into every lineup. A good standalone RB or WR may offer greater expected tournament value than a weak opposing correlation.
8. SE vs. 3-Max priorities
Single-Entry
Balanced ceiling
Preferred QB: Matthew Stafford or Drake Maye
Core considerations: Bijan Robinson, Puka Nacua, Kyren Williams, Drake London, Trey McBride.
Construction: One primary stack, one premium ceiling anchor, two or three differentiated pieces. Avoid building a lineup that combines all the most popular expensive players without meaningful leverage elsewhere.
3-Max
Diversified leverage
Preferred QB rotation: Stafford, Maye, Mahomes
Core considerations: Bijan Robinson, Brock Bowers, Rashee Rice, DJ Moore, Chuba Hubbard, Dalton Kincaid.
Construction: Diversify game environments and stack combinations, rather than making three minor variations of the same chalk lineup.
Huntley-specific strategy
Huntley’s assumed 30.0 SACP makes him interesting, but I would not make him a primary SE quarterback with only a 15-point projection and no verified salary or ownership.
In 3-Max, he is a speculative candidate if his salary is low enough and his projected ownership supports the leverage case. His teammates’ pre-injury projections should not be treated as fully updated.
9. Key fragile-chalk/fade considerations
Projected ownership concentration
RST% of major premium players
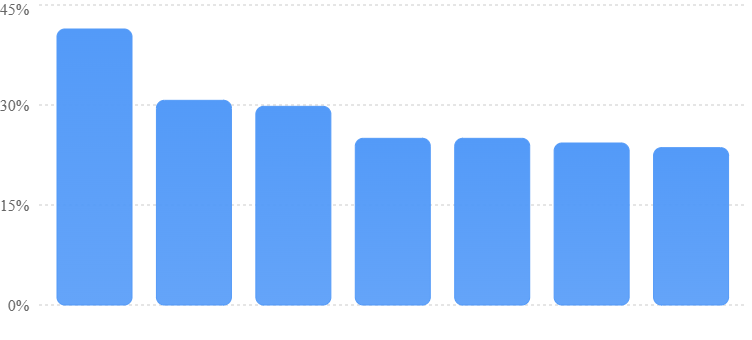
| Player | RST% | Decision | Reason |
|---|---|---|---|
| Puka Nacua | 41.4% | Selective underweight | Elite ceiling, but significant ownership |
| Jonathan Taylor | 30.7% | Conditional pivot | Strong play, but expensive and popular |
| Bijan Robinson | 29.8% | Retain as core | Exceptional ceiling despite ownership |
| Kenneth Walker | 25.0% | Selective | Expensive alternative in a crowded RB tier |
| Kyren Williams | 25.0% | Stack-dependent | Valuable in Rams builds |
| Drake London | 24.3% | Retain selectively | High individual ceiling |
| Davante Adams | 23.6% | Evaluate relative to Puka | Potential differentiation within Rams stacks |
| Zay Flowers | 15.5% | Reassess | Huntley changes passing-game assumptions |
| Isaiah Likely | 9.8% | Reassess | Replacement-QB target distribution unknown |
The most important distinction is between good chalk and fragile chalk.
Bijan is popular because his modeled ceiling is exceptional. Fading him solely because of ownership sacrifices a great deal of upside.
Puka is also an excellent play, but at 41.4% ownership, his tournament value becomes highly dependent on lineup construction.
Baltimore is a separate situation: Flowers and Likely should not be treated as confirmed good or bad chalk until their projections are updated for Huntley.
10. Final condensed player pool and slate strategy
Here is the reduced player pool I would carry into the next stage of Stokastic lineup construction.
| Position | Primary pool | Leverage alternatives |
|---|---|---|
| QB | Stafford, Maye, Allen | Mahomes, Cousins, Huntley* |
| RB | Bijan, Taylor, Kyren, Hubbard | Henry, Stevenson, Bucky Irving |
| WR | Puka, London, Adams, Olave | Rice, DJ Moore, A.J. Brown |
| TE | Bowers, McBride, Kelce | Kincaid, Goedert, Likely* |
| DEF | Baltimore, New England, Indianapolis | Tampa Bay, New York Giants |
*Huntley is a provisional scenario player. Likely requires a replacement-QB projection adjustment.
Final Diamond Life strategy
My preferred approach is to build around two primary game environments, with one higher-ceiling environment and one lower-owned alternative.
PRIMARY ENVIRONMENT
LAR vs. ARI
Stafford, Puka, Adams or Kyren, with McBride or Michael Wilson as opposing options.
This offers the strongest combined modeled offensive ceiling.
LEVERAGE ENVIRONMENT
KC vs. LAC
Mahomes, Rice and Kelce, with a validated LAC bring-back.
This is a more aggressive ownership-driven alternative, not the second-highest projected game.
Final priority order: Establish your QB stack first, choose one premium ceiling anchor, then use the remaining salary to capture right-tail value without unnecessarily duplicating popular roster combinations.
The best tournament strategy is not necessarily to roster the highest-SACP players at every position. It is to construct a lineup where several players can reach their ceilings together, while maintaining enough ownership separation to compete for first place.
The report is based on Solver 39’s modeled results and your Huntley assumptions, not a newly rerun game-correlated simulation. The player pool, slate matchups, injury statuses and projections should be revalidated before lock.
Fan Duel Week 6 Main SLate
General discussion: Game environments and slate dynamics
The biggest takeaway from this slate is that the highest-projected players are not necessarily the strongest tournament investments once ownership, salary and right-tail ceiling are considered.
Our Diamond Life framework highlights three major strategic opportunities:
- Elite raw ceiling: Bijan Robinson, Puka Nacua and Josh Allen lead their respective positions, but ownership is concentrated around several of these players.
- Midrange leverage: Matthew Stafford, Garrett Wilson, James Cook and Trey McBride provide strong ceiling access without requiring the same ownership commitment.
- Correlated game stacking: ARI–LAR and BUF–LV lead the aggregate offensive ceiling rankings, while ATL–CHI offers a compelling alternative built around high-upside skill players.
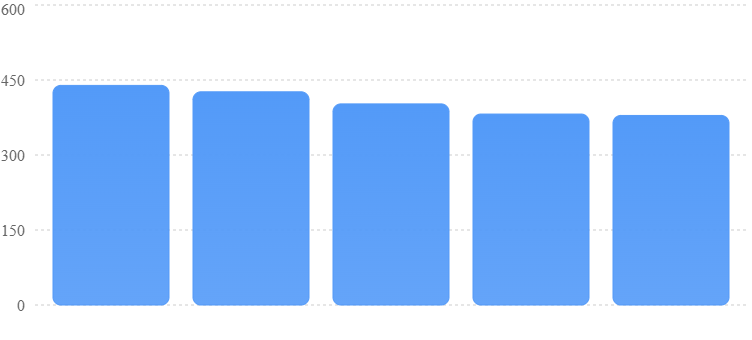
TOP FIVE OFFENSIVE ENVIRONMENTS
Combined offensive SACP by matchup
Sum of player SACP scores, not game-correlated simulations
The key is not simply chasing the highest Vegas totals. We want the intersection of strong offensive ceilings, favorable scoring environments, affordable stack combinations, and ownership that has not fully priced in the upside.
1. Top solver plays by position
These are the five leading players at each position by SACP, with ownership included to distinguish raw ceiling from tournament leverage.
Quarterbacks
| Rank | Player | Salary | P95 | RST% | SACP |
|---|---|---|---|---|---|
| 1 | Josh Allen | $7,500 | 43.19 | 20.1% | 47.26 |
| 2 | Matthew Stafford | $6,400 | 37.81 | 9.7% | 41.73 |
| 3 | Drake Maye | $6,600 | 35.23 | 8.3% | 38.01 |
| 4 | Lamar Jackson | $6,700 | 34.17 | 7.0% | 36.69 |
| 5 | Patrick Mahomes | $6,500 | 31.84 | 4.7% | 34.39 |
Solver read: Allen has the highest raw ceiling. Stafford is the most compelling combination of salary, projection and lower ownership. Mahomes and Jackson provide additional differentiation.
Running backs
| Rank | Player | Salary | P95 | RST% | SACP |
|---|---|---|---|---|---|
| 1 | Bijan Robinson | $8,700 | 55.98 | 20.6% | 63.02 |
| 2 | Jonathan Taylor | $8,000 | 46.97 | 39.1% | 52.02 |
| 3 | Kyren Williams | $6,800 | 43.91 | Invalid | 48.21 |
| 4 | Kenneth Walker | $8,500 | 42.27 | 23.6% | 46.72 |
| 5 | James Cook | $7,400 | 34.19 | 7.9% | 38.16 |
Solver read: Bijan is the strongest premium anchor. Taylor has excellent raw ceiling but considerably higher ownership. Cook stands out as a midrange alternative.
Kyren’s source RST% is 106.5%, so his ownership-dependent scores cannot be trusted until corrected.
Wide receivers
| Rank | Player | Salary | P95 | RST% | SACP |
|---|---|---|---|---|---|
| 1 | Puka Nacua | $8,100 | 56.67 | 40.9% | 64.30 |
| 2 | Drake London | $7,000 | 45.19 | 26.5% | 51.41 |
| 3 | Chris Olave | $7,600 | 39.25 | 16.8% | 43.71 |
| 4 | Davante Adams | $6,600 | 36.99 | 17.9% | 42.01 |
| 5 | Zay Flowers | $7,100 | 36.82 | 18.1% | 41.15 |
Solver read: Puka is the strongest ceiling receiver, but his ownership creates an opportunity for leverage through London, Adams, Garrett Wilson and Michael Wilson.
Tight ends
| Rank | Player | Salary | P95 | RST% | SACP |
|---|---|---|---|---|---|
| 1 | Trey McBride | $7,200 | 38.43 | 5.3% | 44.28 |
| 2 | Brock Bowers | $7,500 | 39.33 | 11.5% | 44.01 |
| 3 | Isaiah Likely | $4,800 | 30.06 | 12.9% | 34.05 |
| 4 | Tyler Warren | $5,300 | 29.27 | 7.6% | 32.84 |
| 5 | Travis Kelce | $5,500 | 25.94 | 4.2% | 29.43 |
Solver read: McBride is my preferred premium TE because his ceiling score matches Bowers while attracting less ownership. Likely offers excellent salary-adjusted upside.
Defenses
| Rank | Defense | Salary | P95 | RST% | SACP |
|---|---|---|---|---|---|
| 1 | New England | $3,500 | 19.35 | 5.4% | 22.21 |
| 2 | Indianapolis | $3,400 | 19.44 | 6.4% | 22.03 |
| 3 | Kansas City | $3,600 | 18.70 | 5.3% | 21.74 |
| 4 | LA Rams | $3,800 | 18.27 | 3.0% | 20.72 |
| 5 | Baltimore | $3,200 | 18.16 | 6.9% | 20.50 |
Solver read: New England and Indianapolis lead, but the Rams offer attractive low-owned ceiling. Avoid selecting a defense against your own heavily stacked offense.
2. Best spend-ups
For spend-ups, I prioritize P95 ceiling, SACP and the ownership cost of paying a premium salary.
| Priority | Player | Salary | SACP | Assessment |
|---|---|---|---|---|
| 1 | Bijan Robinson | $8,700 | 63.02 | Best premium RB anchor |
| 2 | Puka Nacua | $8,100 | 64.30 | Highest WR ceiling, heavy chalk |
| 3 | Trey McBride | $7,200 | 44.28 | Best premium TE leverage |
| 4 | Josh Allen | $7,500 | 47.26 | Highest QB ceiling |
| 5 | Drake London | $7,000 | 51.41 | Strong alternative WR anchor |
| 6 | Jonathan Taylor | $8,000 | 52.02 | Excellent ceiling, high ownership |

Top overall spend-up: Bijan Robinson
His 55.98 P95 and 63.02 SACP make him my preferred RB centerpiece. He offers more ownership leverage than Taylor while maintaining superior modeled ceiling.

Best leverage spend-up: Trey McBride
A premium TE with just 5.3% projected ownership and the highest SACP at his position. He can change roster construction and reduce duplication.
My preferred spend-up combination is Bijan plus one premium receiver or TE, rather than forcing every expensive chalk play into the same roster.
3. Best values
These are the players offering attractive modeled ceilings relative to their salaries.
| Player | Pos. | Salary | P95 | RST% | Right-Tail MME |
|---|---|---|---|---|---|
| Kirk Cousins | QB | $5,400 | 30.89 | 7.6% | 6.16 |
| Cam Ward | QB | $4,800 | 26.30 | 3.2% | 6.02 |
| Chuba Hubbard | RB | $6,300 | 34.46 | 10.8% | 5.52 |
| Rhamondre Stevenson | RB | $6,000 | 29.78 | 14.7% | 5.11 |
| Carnell Tate | WR | $5,000 | 30.21 | 13.7% | 6.23 |
| Wan’Dale Robinson | WR | $4,500 | 24.80 | 7.9% | 5.97 |
| Isaiah Likely | TE | $4,800 | 30.06 | 12.9% | 6.57 |
| Dallas Goedert | TE | $3,900 | 23.64 | 6.8% | 6.71 |
| Carolina DST | DST | $2,500 | 17.59 | 19.5% | 7.06 |
Best value by position: Cousins at QB, Hubbard at RB, Tate at WR, Likely at TE and Carolina for inexpensive defense.
Tate and Likely are especially interesting because they create salary flexibility without completely sacrificing a high-end fantasy outcome. Goedert is the preferred deeper TE salary-saving option.
These selections remain conditional on actual player eligibility and role confirmation.
4. Best sleepers/right-tail separators
This category is particularly important for our Diamond Life tournament approach. We want players who can reach a competitive ceiling at ownership levels that materially separate our lineups.
| Player | Pos. | Salary | RST% | P95 | SACP |
|---|---|---|---|---|---|
| Patrick Mahomes | QB | $6,500 | 4.7% | 31.84 | 34.39 |
| Lamar Jackson | QB | $6,700 | 7.0% | 34.17 | 36.69 |
| Derrick Henry | RB | $8,200 | 2.2% | 30.84 | 34.39 |
| Jaylen Warren | RB | $7,000 | 3.2% | 30.64 | 34.15 |
| Bucky Irving | RB | $6,200 | 3.1% | 28.10 | 31.00 |
| Garrett Wilson | WR | $6,800 | 5.2% | 33.54 | 37.40 |
| Michael Wilson | WR | $6,700 | 2.7% | 30.27 | 34.17 |
| Malik Nabers | WR | $6,500 | 7.5% | 31.17 | 34.42 |
| Trey McBride | TE | $7,200 | 5.3% | 38.43 | 44.28 |
| Harold Fannin | TE | $4,100 | 4.7% | 23.81 | 26.68 |
Three standout separators

Michael Wilson — WR
At 2.7% ownership, Wilson has a 30.27 P95. He is one of the most interesting low-owned receivers in the player pool and offers an alternative way to gain exposure to ARI–LAR.

Patrick Mahomes — QB
A 4.7% RST gives Mahomes a different tournament path from Allen. His modeled ceiling is lower, but a successful correlated passing stack could provide meaningful leverage.

Garrett Wilson — WR
His 37.40 SACP and 5.2% ownership make him a particularly attractive mid-to-upper-tier WR pivot. He retains a 33.54 P95 without the ownership burden of the most popular receivers.
The goal is not to roster every sleeper together. I prefer one or two high-conviction separators supported by a strong game script, alongside more reliable ceiling plays.
5. Top five game environments
| Rank | Matchup | Vegas O/U | Combined SACP | Combined P95 |
|---|---|---|---|---|
| 1 | ARI–LAR | 51.5 | 439.2 | 391.3 |
| 2 | BUF–LV | 53.5 | 426.4 | 381.7 |
| 3 | ATL–CHI | 52.0 | 402.2 | 360.2 |
| 4 | NO–NYG | 46.0 | 381.9 | 342.6 |
| 5 | NE–NYJ | 43.5 | 379.1 | 341.1 |
Environment interpretation
ARI–LAR — Best overall: The combination of Stafford, Puka, Adams, McBride and Michael Wilson creates multiple routes to ceiling. The strength here is the availability of high-upside players on both sides.
BUF–LV — Highest-total game: Allen is the strongest raw-ceiling QB, and Bowers provides a premium opposing option. This environment has an attractive scoring forecast, but the right supporting receivers must be confirmed.
ATL–CHI — Best alternative: Bijan and London provide substantial offensive ceiling, while Caleb Williams offers a lower-owned QB approach.
NO–NYG — Contrarian scoring environment: The solver identifies more aggregate upside than the lower total might initially suggest. This is an interesting environment to investigate for secondary stacks.
NE–NYJ — Highest-risk leverage candidate: The 43.5 total is less favorable, but Maye and Garrett Wilson have attractive individual ceiling scores. It is a better large-field consideration than a primary single-entry target.
The distinction is important: a high aggregate SACP can reflect many projected players, not necessarily an unusually strong game environment. Correlated simulations would be needed to quantify the actual likelihood of multiple players simultaneously reaching their ceilings.
6. Best full onslaught/game-stack environments
For a full onslaught, I prefer QB + two pass catchers + one bring-back, with an optional fifth player when both offenses have concentrated production.
| Rank | Game | Core stack | Bring-back | Assessment |
|---|---|---|---|---|
| 1 | ARI–LAR | Stafford + Puka + Adams | McBride / M. Wilson | Strongest aggregate ceiling |
| 2 | BUF–LV | Allen + verified BUF receivers | Bowers | Highest-total QB onslaught |
| 3 | ATL–CHI | Caleb + Bears receivers | London / Bijan | Lower-owned QB construction |
| 4 | NO–NYG | Shough + Olave + NO receiver | Nabers | Contrarian game stack |
| 5 | NE–NYJ | Maye + Patriots receivers | Garrett Wilson | Higher-risk, lower-total stack |
Preferred full onslaught: ARI–LAR
Rams passing attack
Primary stack

Stafford
QB

Nacua
WR

Adams
WR
Opposing bring-back

Trey McBride

Michael Wilson
This structure offers high-end receiving ceilings and two potential Arizona bring-backs. The principal concern is ownership concentration around Puka, especially when combined with other popular players.
For large-field tournaments, the additional Michael Wilson bring-back creates a more aggressive five-player construction.
7. Recommended bring-back structures
Bring-backs are most valuable when the opposing offense can plausibly force the primary stack to keep scoring.
| Primary QB | Primary stack | Preferred bring-back | Optional second bring-back |
|---|---|---|---|
| Stafford | Puka + Adams | Trey McBride | Michael Wilson |
| Allen | Two verified BUF pass catchers | Brock Bowers | Tre Tucker |
| Caleb Williams | Two Bears receivers | Drake London | Bijan Robinson |
| Tyler Shough | Olave + Juwan Johnson | Malik Nabers | Additional verified NYG receiver |
| Drake Maye | Two verified NE pass catchers | Garrett Wilson | Additional verified NYJ receiver |
My preferred approach: One strong bring-back is usually sufficient in SE. For 3-Max and larger fields, I am more willing to use two bring-backs if the game has the ceiling and volume concentration to justify five or six roster spots.
I would avoid automatically adding a second opposing player simply because a game has a high Vegas total. Every additional player must improve the correlated ceiling story.
8. SE vs. 3-Max priorities
| Decision | Single-Entry | 3-Max |
|---|---|---|
| QB | Stafford / Allen | Stafford, Allen, Mahomes |
| Primary RB | Bijan | Bijan, Taylor, Cook |
| Premium WR | Puka / London | Puka, London, Olave |
| TE | McBride / Likely | McBride, Bowers, Likely |
| Game stack | ARI–LAR | ARI–LAR, BUF–LV, ATL–CHI |
| Leverage | 1–2 strong separators | Different QB stacks and game scripts |
| Onslaught size | 3–4 players | 4–5 players selectively |
Single-entry strategy
For SE, I want a roster with a high probability of being competitive while still maintaining first-place ceiling.
My preferred starting framework is:
- Stafford as the QB anchor.
- Bijan as the premium RB.
- One elite receiving option, ideally from the primary game stack.
- McBride or Likely at TE.
- One lower-owned WR or RB with strong right-tail access.
I would not force all of these players into the same lineup if it weakens the salary structure or game correlation.
3-Max strategy
I prefer three distinct lineup concepts rather than three slight variations of the same core.
Entry 1 — Strongest modeled passing environment
ARI–LAR
Stafford stack, with McBride as the primary bring-back. Emphasize raw ceiling and controlled leverage.
Entry 2 — Premium QB ceiling
BUF–LV
Allen stack with Bowers as the bring-back. Differentiate through secondary skill positions.
Entry 3 — Contrarian game script
ATL–CHI
Caleb Williams passing stack with London as a bring-back, conditional on verified roles and matchup.
These three constructions provide different routes to first place instead of relying on the same QB and game outcome.
9. Key fragile-chalk/fade considerations
A high-owned player is not automatically a fade. The question is whether the player’s probability of delivering a tournament-winning score justifies the ownership.
| Player | RST% | P95 | Tournament concern | Approach |
|---|---|---|---|---|
| Puka Nacua | 40.9% | 56.67 | Very high ownership | Play selectively, differentiate elsewhere |
| Jonathan Taylor | 39.1% | 46.97 | Ownership higher than Bijan | Consider Bijan pivot |
| DJ Moore | 30.2% | 31.80 | Ownership concentration relative to ceiling | Consider alternative WRs |
| Drake London | 26.5% | 45.19 | Strong ceiling, moderately popular | Good chalk, not mandatory |
| Kenneth Walker | 23.6% | 42.27 | Expensive relative to alternatives | Selective exposure |
| Carolina DST | 19.5% | 17.59 | Popular salary-saving defense | Consider lower-owned DST |
| Kyren Williams | Invalid | 43.91 | Source ownership exceeds 100% | Correct data before exposure decisions |
Chalk I am comfortable keeping
Bijan Robinson: His ceiling advantage is large enough to justify meaningful ownership.
Puka Nacua: A strong raw-ceiling play, but I would be cautious about pairing him with too many other highly owned pieces.
Drake London: His 51.41 SACP gives him enough upside to remain a strong tournament consideration.
Chalk I am more willing to pivot away from
Jonathan Taylor: The 39.1% ownership creates a strong reason to consider Bijan, especially if roster construction permits.
DJ Moore: At 30.2% ownership, I would compare his ceiling directly with lower-owned Garrett Wilson, Malik Nabers and Michael Wilson.
Carolina DST: The salary savings are appealing, but defensive scoring is volatile. A lower-owned defense with a comparable modeled ceiling may offer better tournament separation.
10. Final condensed player pool and slate strategy
This is the focused pool I would use to begin optimizer construction. It is intentionally narrower than the full player universe.
Condensed tournament pool
| Position | Primary targets | Leverage / alternatives |
|---|---|---|
| QB | Stafford, Allen | Mahomes, Lamar, Maye |
| RB | Bijan, Taylor, Cook | Hubbard, Warren, Irving |
| WR | Puka, London, Olave, Adams | Garrett Wilson, Michael Wilson, Nabers, Tate |
| TE | McBride, Likely | Bowers, Goedert, Kelce |
| DST | New England, Indianapolis | LA Rams, Pittsburgh, Kansas City |
Final priority board
Best overall anchor
Elite RB ceiling
Bijan Robinson
Preferred tournament QB
Projection plus leverage
Matthew Stafford
Best premium WR
Raw ceiling leader
Puka Nacua
Best premium leverage
High-end TE separation
Trey McBride
Best WR separator
Low-owned right-tail upside
Michael Wilson
Best value TE
Salary-adjusted ceiling
Isaiah Likely
Final Diamond Life strategy
My preferred approach is to build around one premium RB, a correlated QB passing stack, one meaningful bring-back, and one or two low-owned right-tail separators.
ARI–LAR is my leading game-stack candidate, while BUF–LV offers the strongest Vegas scoring forecast among the five identified environments. ATL–CHI is the alternative I would investigate for a different game script.
The biggest opportunity is not necessarily fading the best players. It is finding a way to retain elite ceiling while avoiding the most duplicated combinations.


Leave a Reply